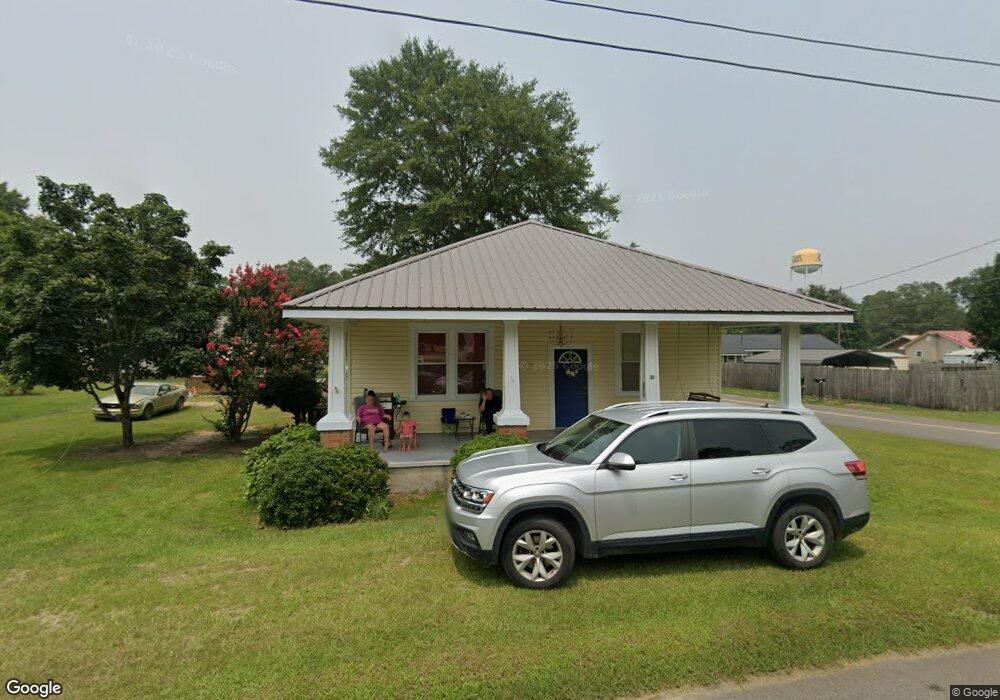
31 Elm St Butler, GA 31006
Estimated Value: $86,365 - $131,000
3
Beds
1
Bath
988
Sq Ft
$111/Sq Ft
Est. Value
About This Home
This home is located at 31 Elm St, Butler, GA 31006 and is currently estimated at $109,841, approximately $111 per square foot. 31 Elm St is a home located in Taylor County with nearby schools including Taylor County Primary School, Taylor County Upper Elementary School, and Taylor County Middle School.
Ownership History
Date
Name
Owned For
Owner Type
Purchase Details
Closed on
Nov 7, 2019
Sold by
Hopson Jo Ann
Bought by
Thaxton Lynn Ann
Current Estimated Value
Purchase Details
Closed on
Aug 11, 2014
Sold by
Asr Investments Llc
Bought by
Hopson Jo Ann
Home Financials for this Owner
Home Financials are based on the most recent Mortgage that was taken out on this home.
Original Mortgage
$110,000
Interest Rate
4.19%
Mortgage Type
New Conventional
Purchase Details
Closed on
Jun 9, 2014
Sold by
Nationstar Mtg Llc
Bought by
Asr Investments Llc
Purchase Details
Closed on
Apr 1, 2014
Sold by
Hicks Michael
Bought by
Nationstar Mtg Llc
Purchase Details
Closed on
Nov 19, 2007
Sold by
Lawhorn Laura Ashley
Bought by
Hicks Michael
Home Financials for this Owner
Home Financials are based on the most recent Mortgage that was taken out on this home.
Original Mortgage
$60,235
Interest Rate
6.36%
Mortgage Type
FHA
Purchase Details
Closed on
Sep 11, 2000
Sold by
Bazemore Ah Riley
Bought by
Newmans Cherri N and Newmans K
Create a Home Valuation Report for This Property
The Home Valuation Report is an in-depth analysis detailing your home's value as well as a comparison with similar homes in the area
Home Values in the Area
Average Home Value in this Area
Purchase History
| Date | Buyer | Sale Price | Title Company |
|---|---|---|---|
| Thaxton Lynn Ann | -- | -- | |
| Hopson Jo Ann | $49,000 | -- | |
| Asr Investments Llc | $24,960 | -- | |
| Nationstar Mtg Llc | -- | -- | |
| Hicks Michael | $60,711 | -- | |
| Newmans Cherri N | -- | -- |
Source: Public Records
Mortgage History
| Date | Status | Borrower | Loan Amount |
|---|---|---|---|
| Previous Owner | Hopson Jo Ann | $110,000 | |
| Previous Owner | Hicks Michael | $60,235 |
Source: Public Records
Tax History Compared to Growth
Tax History
| Year | Tax Paid | Tax Assessment Tax Assessment Total Assessment is a certain percentage of the fair market value that is determined by local assessors to be the total taxable value of land and additions on the property. | Land | Improvement |
|---|---|---|---|---|
| 2024 | $947 | $30,080 | $1,480 | $28,600 |
| 2023 | $794 | $24,120 | $1,480 | $22,640 |
| 2022 | $535 | $21,280 | $1,480 | $19,800 |
| 2021 | $516 | $20,040 | $1,480 | $18,560 |
| 2020 | $520 | $20,040 | $1,480 | $18,560 |
| 2019 | $473 | $20,040 | $1,480 | $18,560 |
| 2018 | $677 | $19,880 | $1,320 | $18,560 |
| 2017 | $291 | $19,058 | $1,500 | $17,558 |
| 2016 | $323 | $20,234 | $1,500 | $18,734 |
| 2015 | -- | $20,234 | $1,500 | $18,734 |
| 2014 | -- | $19,553 | $900 | $18,653 |
| 2013 | -- | $20,680 | $1,100 | $19,580 |
Source: Public Records
Map
Nearby Homes
- 13 Marshall St
- 0 Georgia 127 Unit 25831251
- 0 Georgia 137
- 0 Allmon Rd Unit 25510364
- 0 Allmon Rd Unit 24144380
- 0 Allmon Rd Unit 10319213
- 0 Allmon Rd Unit 25510570
- 0 Allmon Rd Unit 10319234
- 0 Allmon Rd Unit 25510363
- 0 Allmon Rd Unit 25510361
- 0 Allmon Rd Unit 10319221
- 0 Allmon Rd Unit 10319208
- 0 Allmon Rd Unit 25510366
- 0 Allmon Rd Unit 10319216
- 010 Mallard Rd
- 29 Mallard Rd
- Parcel 2 Whipporwill Rd
- Parcel 3 Whipporwill Rd
- Parcel 1 Whipporwill Rd
- 160 Underwood Rd