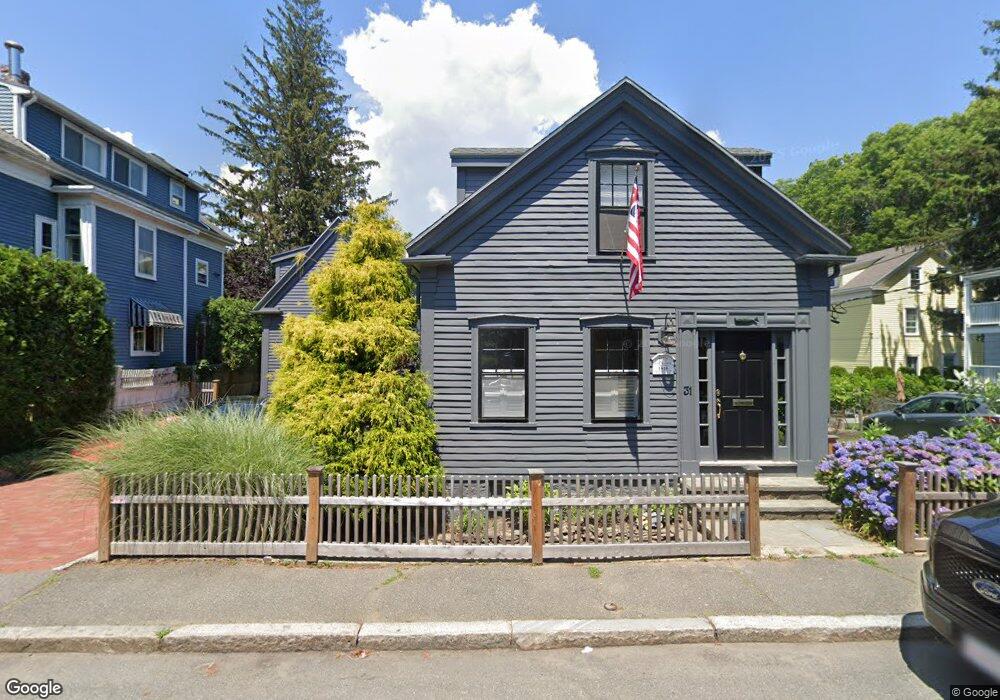
31 Elm St Marblehead, MA 01945
Estimated Value: $1,221,000 - $1,474,698
3
Beds
3
Baths
1,903
Sq Ft
$708/Sq Ft
Est. Value
About This Home
This home is located at 31 Elm St, Marblehead, MA 01945 and is currently estimated at $1,347,425, approximately $708 per square foot. 31 Elm St is a home located in Essex County with nearby schools including Marblehead High School, Marblehead Community Charter Public School, and Devereux School.
Ownership History
Date
Name
Owned For
Owner Type
Purchase Details
Closed on
Aug 24, 2020
Sold by
Aspinall Jennie E
Bought by
Bibby Chase M and Bibby Kristen N
Current Estimated Value
Home Financials for this Owner
Home Financials are based on the most recent Mortgage that was taken out on this home.
Original Mortgage
$690,000
Outstanding Balance
$610,700
Interest Rate
3%
Mortgage Type
Purchase Money Mortgage
Estimated Equity
$736,725
Purchase Details
Closed on
Aug 30, 2011
Sold by
Burton Andrew and Burton Tinabeth
Bought by
Aspinall Jennie E
Purchase Details
Closed on
Jul 9, 2004
Sold by
Lubas Amy C and Lubas Mark
Bought by
Burton Andrew and Burton Tinabeth
Purchase Details
Closed on
Jul 1, 1997
Sold by
Est Shattuck Elizabeth
Bought by
Lubas Mark and Lubas Amy C
Create a Home Valuation Report for This Property
The Home Valuation Report is an in-depth analysis detailing your home's value as well as a comparison with similar homes in the area
Home Values in the Area
Average Home Value in this Area
Purchase History
| Date | Buyer | Sale Price | Title Company |
|---|---|---|---|
| Bibby Chase M | $875,000 | None Available | |
| Bibby Chase M | $875,000 | None Available | |
| Aspinall Jennie E | $652,500 | -- | |
| Aspinall Jennie E | $652,500 | -- | |
| Burton Andrew | $750,000 | -- | |
| Burton Andrew | $750,000 | -- | |
| Lubas Mark | $200,000 | -- | |
| Lubas Mark | $200,000 | -- |
Source: Public Records
Mortgage History
| Date | Status | Borrower | Loan Amount |
|---|---|---|---|
| Open | Bibby Chase M | $690,000 | |
| Closed | Bibby Chase M | $690,000 | |
| Previous Owner | Lubas Mark | $488,000 |
Source: Public Records
Tax History Compared to Growth
Tax History
| Year | Tax Paid | Tax Assessment Tax Assessment Total Assessment is a certain percentage of the fair market value that is determined by local assessors to be the total taxable value of land and additions on the property. | Land | Improvement |
|---|---|---|---|---|
| 2025 | $11,416 | $1,261,400 | $750,100 | $511,300 |
| 2024 | $10,961 | $1,223,300 | $750,100 | $473,200 |
| 2023 | $9,782 | $978,200 | $646,200 | $332,000 |
| 2022 | $9,791 | $930,700 | $577,000 | $353,700 |
| 2021 | $9,578 | $919,200 | $565,500 | $353,700 |
| 2020 | $8,770 | $844,100 | $553,900 | $290,200 |
| 2019 | $8,694 | $809,500 | $519,300 | $290,200 |
| 2018 | $8,285 | $751,800 | $461,600 | $290,200 |
| 2017 | $8,023 | $728,700 | $438,500 | $290,200 |
| 2016 | $7,577 | $682,600 | $392,400 | $290,200 |
| 2015 | $7,418 | $669,500 | $369,300 | $300,200 |
| 2014 | $6,787 | $612,000 | $369,300 | $242,700 |
Source: Public Records
Map
Nearby Homes
- 25 Pearl St
- 24 Russell St
- 20 Mechanic Square Unit 2
- 20 Mechanic Square Unit 3
- 45 Washington St Unit 3
- 29 High St
- 3 Frost Ln Unit 1
- 1 Green St Unit 2
- 8 Franklin St Unit 19
- 75 Pond St
- 108 Front St
- 45 Pleasant St
- 33 Intrepid Cir Unit 208
- 37 Peach Highlands
- 9 Darling St
- 45 Peach Highlands
- 95 Front St Unit 5
- 132 Elm St
- 132 Elm St Unit 132
- 134 Elm St