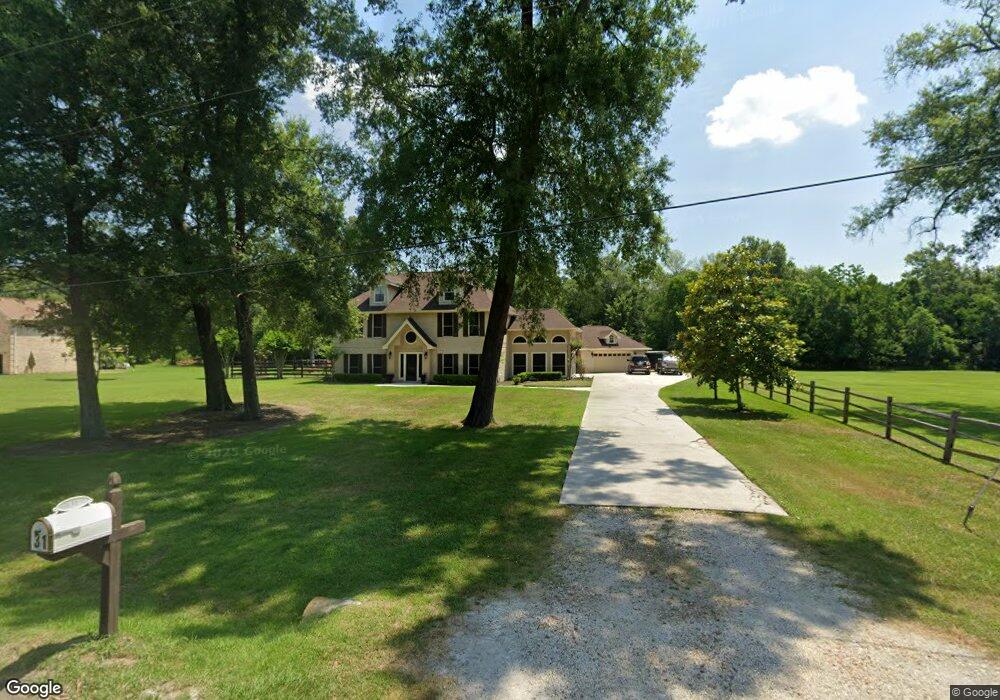
31 Enchanted Ln Dayton, TX 77535
Estimated Value: $451,000 - $514,000
5
Beds
4
Baths
3,592
Sq Ft
$137/Sq Ft
Est. Value
About This Home
This home is located at 31 Enchanted Ln, Dayton, TX 77535 and is currently estimated at $491,629, approximately $136 per square foot. 31 Enchanted Ln is a home located in Liberty County with nearby schools including Austin Elementary School, Richter Elementary School, and Kimmie M. Brown Elementary School.
Ownership History
Date
Name
Owned For
Owner Type
Purchase Details
Closed on
Jul 31, 2019
Sold by
Merrill William Randolph and Merrill Bonita Tyson
Bought by
Thibodeaux Herman and Hall Venita
Current Estimated Value
Home Financials for this Owner
Home Financials are based on the most recent Mortgage that was taken out on this home.
Original Mortgage
$269,500
Outstanding Balance
$236,516
Interest Rate
3.8%
Mortgage Type
New Conventional
Estimated Equity
$255,113
Purchase Details
Closed on
May 3, 2011
Sold by
Brookfield Global Relocation Services Ll
Bought by
Merrill Randolph and Merrill Bonita Tyson
Home Financials for this Owner
Home Financials are based on the most recent Mortgage that was taken out on this home.
Original Mortgage
$192,000
Interest Rate
4.87%
Mortgage Type
New Conventional
Purchase Details
Closed on
Nov 30, 2010
Sold by
Honeyman Marshall C and Honeyman Sherry L
Bought by
Brookfield Global Relocation Services Ll
Create a Home Valuation Report for This Property
The Home Valuation Report is an in-depth analysis detailing your home's value as well as a comparison with similar homes in the area
Home Values in the Area
Average Home Value in this Area
Purchase History
| Date | Buyer | Sale Price | Title Company |
|---|---|---|---|
| Thibodeaux Herman | -- | None Available | |
| Merrill Randolph | -- | None Available | |
| Brookfield Global Relocation Services Ll | -- | None Available |
Source: Public Records
Mortgage History
| Date | Status | Borrower | Loan Amount |
|---|---|---|---|
| Open | Thibodeaux Herman | $269,500 | |
| Previous Owner | Merrill Randolph | $192,000 |
Source: Public Records
Tax History Compared to Growth
Tax History
| Year | Tax Paid | Tax Assessment Tax Assessment Total Assessment is a certain percentage of the fair market value that is determined by local assessors to be the total taxable value of land and additions on the property. | Land | Improvement |
|---|---|---|---|---|
| 2025 | $6,694 | $480,000 | $69,000 | $411,000 |
| 2024 | $6,694 | $467,335 | -- | -- |
| 2023 | $6,694 | $424,850 | $54,160 | $370,690 |
| 2022 | $10,087 | $424,540 | $47,270 | $377,270 |
| 2021 | $9,891 | $387,900 | $29,050 | $358,850 |
| 2020 | $10,015 | $384,700 | $25,850 | $358,850 |
| 2019 | $10,105 | $371,380 | $25,850 | $345,530 |
| 2018 | $9,809 | $359,460 | $25,850 | $333,610 |
| 2017 | $9,959 | $359,460 | $25,850 | $333,610 |
| 2016 | $9,038 | $326,220 | $25,850 | $300,370 |
| 2015 | $7,084 | $291,070 | $25,850 | $265,220 |
| 2014 | $7,084 | $277,050 | $20,430 | $256,620 |
Source: Public Records
Map
Nearby Homes
- 4 Hickory Ln
- 9 Slover Dr
- 0 Fm 1008 Unit 22715374
- 0 Fm 1008 Unit 22715425
- 2150 NE Clayton St
- 33 Little John Ln
- 12032 Farm To Market Road 1008
- 815 County Road 6324
- 59 County Road 6324a
- 124 County Rd
- 0 Laird St
- 109 County Road 6324
- 142 County Road 6324b
- 2007 Juanita St
- 0000 Cherry Creek Rd
- 00 Cherry Creek Rd
- 0 Cherry Creek Rd
- 435 County Road 6324
- 1138 County Road 6324
- 1163 County Road 6324
- 33 Enchanted Ln
- 29 Enchanted Ln
- 26 Enchanted Ln
- 24 Enchanted Ln
- 24 Enchanted Ln
- 28 Linney Creek Dr
- 21 Mockingbird Ln
- 30 Linney Creek Dr
- 22 Mockingbird Ln
- 19 Mockingbird Ln
- 23 Mockingbird Ln
- 2 Mockingbird Ln
- 34 Ranchwood Ln
- 34 Ranchwood Ln
- 18 Mockingbird Ln
- 3 Linney Creek Dr
- 18 Ranchwood Ln
- 35 Ranchwood Ln
- 103 Mockingbird Ln
- 16 Ranchwood Ln