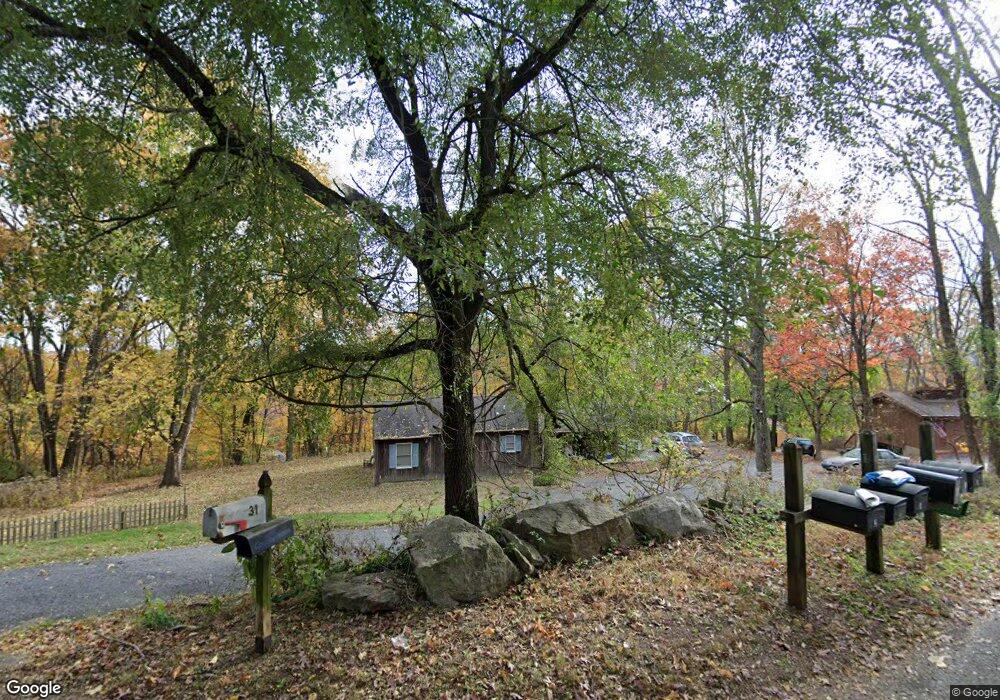
31 Fine Rd High Bridge, NJ 08829
Estimated Value: $271,000 - $457,000
--
Bed
--
Bath
1,228
Sq Ft
$324/Sq Ft
Est. Value
About This Home
This home is located at 31 Fine Rd, High Bridge, NJ 08829 and is currently estimated at $398,034, approximately $324 per square foot. 31 Fine Rd is a home located in Hunterdon County with nearby schools including High Bridge Elementary School, High Bridge Middle School, and Voorhees High School.
Ownership History
Date
Name
Owned For
Owner Type
Purchase Details
Closed on
Oct 1, 2002
Sold by
Mancini Joseph A
Bought by
Brady John S
Current Estimated Value
Home Financials for this Owner
Home Financials are based on the most recent Mortgage that was taken out on this home.
Original Mortgage
$183,200
Interest Rate
6.02%
Purchase Details
Closed on
Apr 6, 2000
Sold by
Dept Of Housing & Urban Dev
Bought by
Mancini Joseph A and Mancini Jamey
Home Financials for this Owner
Home Financials are based on the most recent Mortgage that was taken out on this home.
Original Mortgage
$120,000
Interest Rate
8.3%
Purchase Details
Closed on
Sep 15, 1994
Sold by
Gundlah Robert and Gundlah Catherine A
Bought by
Ciccolini Robert B and Ciccolini Michelle L
Purchase Details
Closed on
Apr 13, 1989
Sold by
Bridges Catherine A and Bridges Gundlah,R
Bought by
Gundlah Robert and Gundlah Catherine A
Create a Home Valuation Report for This Property
The Home Valuation Report is an in-depth analysis detailing your home's value as well as a comparison with similar homes in the area
Home Values in the Area
Average Home Value in this Area
Purchase History
| Date | Buyer | Sale Price | Title Company |
|---|---|---|---|
| Brady John S | $229,000 | -- | |
| Mancini Joseph A | $90,000 | -- | |
| Ciccolini Robert B | $135,000 | -- | |
| Gundlah Robert | -- | -- |
Source: Public Records
Mortgage History
| Date | Status | Borrower | Loan Amount |
|---|---|---|---|
| Previous Owner | Brady John S | $183,200 | |
| Previous Owner | Mancini Joseph A | $120,000 |
Source: Public Records
Tax History Compared to Growth
Tax History
| Year | Tax Paid | Tax Assessment Tax Assessment Total Assessment is a certain percentage of the fair market value that is determined by local assessors to be the total taxable value of land and additions on the property. | Land | Improvement |
|---|---|---|---|---|
| 2025 | $10,331 | $288,900 | $178,000 | $110,900 |
| 2024 | $9,751 | $316,500 | $137,200 | $179,300 |
| 2023 | $9,751 | $246,600 | $113,400 | $133,200 |
| 2022 | $8,876 | $208,600 | $108,400 | $100,200 |
| 2021 | $8,688 | $208,100 | $108,400 | $99,700 |
| 2020 | $8,532 | $208,100 | $108,400 | $99,700 |
| 2019 | $8,597 | $208,100 | $108,400 | $99,700 |
| 2018 | $8,231 | $207,700 | $108,000 | $99,700 |
| 2017 | $8,005 | $207,700 | $108,000 | $99,700 |
| 2016 | $7,911 | $207,700 | $108,000 | $99,700 |
| 2015 | $7,697 | $207,700 | $108,000 | $99,700 |
| 2014 | $9,258 | $270,000 | $173,400 | $96,600 |
Source: Public Records
Map
Nearby Homes