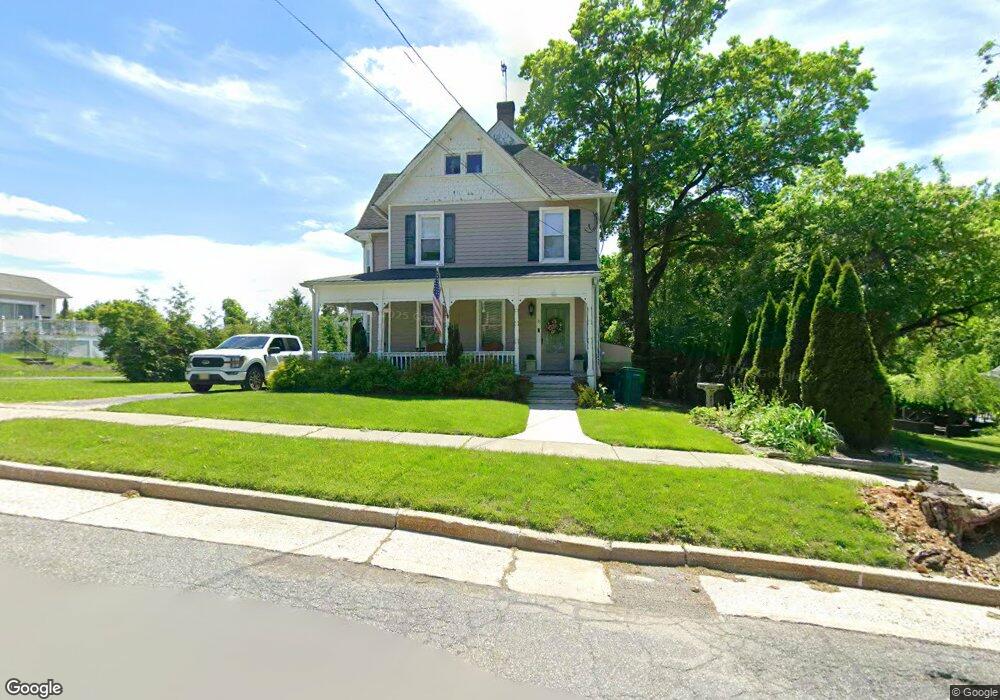
31 Foster St Newton, NJ 07860
Estimated Value: $461,544 - $624,000
--
Bed
--
Bath
2,958
Sq Ft
$184/Sq Ft
Est. Value
About This Home
This home is located at 31 Foster St, Newton, NJ 07860 and is currently estimated at $544,386, approximately $184 per square foot. 31 Foster St is a home located in Sussex County with nearby schools including Merriam Avenue School, Halsted Street Middle School, and Newton High School.
Ownership History
Date
Name
Owned For
Owner Type
Purchase Details
Closed on
Feb 23, 2023
Sold by
Ehrenberg Christopher and Ehrenberg Donna
Bought by
Ehrenberg Christopher and Ehrenberg Donna
Current Estimated Value
Home Financials for this Owner
Home Financials are based on the most recent Mortgage that was taken out on this home.
Original Mortgage
$311,460
Outstanding Balance
$301,257
Interest Rate
6.09%
Mortgage Type
New Conventional
Estimated Equity
$243,129
Purchase Details
Closed on
Aug 15, 1996
Sold by
Lazzaro Carl F and Lazzaro Pamela
Bought by
Ehrenberg Christopher and Stashinsky Donna
Create a Home Valuation Report for This Property
The Home Valuation Report is an in-depth analysis detailing your home's value as well as a comparison with similar homes in the area
Home Values in the Area
Average Home Value in this Area
Purchase History
| Date | Buyer | Sale Price | Title Company |
|---|---|---|---|
| Ehrenberg Christopher | -- | -- | |
| Ehrenberg Christopher | -- | None Listed On Document | |
| Ehrenberg Christopher | $134,276 | -- |
Source: Public Records
Mortgage History
| Date | Status | Borrower | Loan Amount |
|---|---|---|---|
| Open | Ehrenberg Christopher | $311,460 | |
| Closed | Ehrenberg Christopher | $311,460 |
Source: Public Records
Tax History Compared to Growth
Tax History
| Year | Tax Paid | Tax Assessment Tax Assessment Total Assessment is a certain percentage of the fair market value that is determined by local assessors to be the total taxable value of land and additions on the property. | Land | Improvement |
|---|---|---|---|---|
| 2025 | $12,097 | $464,700 | $83,600 | $381,100 |
| 2024 | $11,069 | $443,600 | $71,400 | $372,200 |
| 2023 | $11,069 | $246,300 | $66,400 | $179,900 |
| 2022 | $11,113 | $246,300 | $66,400 | $179,900 |
| 2021 | $11,064 | $246,300 | $66,400 | $179,900 |
| 2020 | $10,894 | $246,300 | $66,400 | $179,900 |
| 2019 | $10,556 | $246,300 | $66,400 | $179,900 |
| 2018 | $10,500 | $246,300 | $66,400 | $179,900 |
| 2017 | $10,438 | $246,300 | $66,400 | $179,900 |
| 2016 | $10,271 | $246,300 | $66,400 | $179,900 |
| 2015 | $10,000 | $246,300 | $66,400 | $179,900 |
| 2014 | $9,793 | $246,300 | $66,400 | $179,900 |
Source: Public Records
Map
Nearby Homes
- 37 Foster St
- 5 Clarkson St
- 13 Summit Ave
- 9 Lawnwood Ave
- 67 Ryerson Ave
- 0 W Nelson St
- 22 Woodside Ave
- 15 Cherry St
- 5 Jefferson St
- 7 Cherry St
- 76 Carriage Ln Unit 76
- 252 Spring St
- 103 Woodside Ave
- 40 Carriage Ln Unit 40
- 32 Trinity St
- 21 Carriage Ln Unit 21
- 52 Trinity St
- 5 Babbitt Ct
- 37 Park Ave
- 63 Merriam Ave