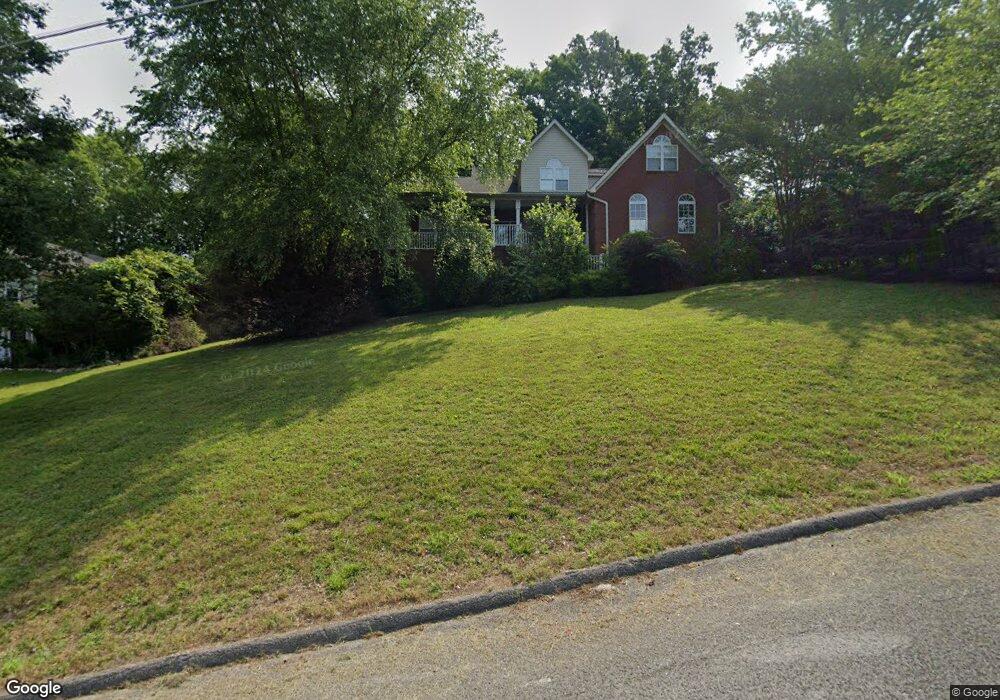
31 Franklin Dr Flintstone, GA 30725
Flintstone NeighborhoodEstimated Value: $301,000 - $452,000
5
Beds
3
Baths
2,940
Sq Ft
$119/Sq Ft
Est. Value
About This Home
This home is located at 31 Franklin Dr, Flintstone, GA 30725 and is currently estimated at $350,618, approximately $119 per square foot. 31 Franklin Dr is a home located in Walker County with nearby schools including Chattanooga Valley Elementary School, Chattanooga Valley Middle School, and Ridgeland High School.
Ownership History
Date
Name
Owned For
Owner Type
Purchase Details
Closed on
Feb 4, 2011
Sold by
Federal National Mortgage Association
Bought by
Didenko Andrey
Current Estimated Value
Home Financials for this Owner
Home Financials are based on the most recent Mortgage that was taken out on this home.
Original Mortgage
$175,339
Outstanding Balance
$117,619
Interest Rate
4.37%
Mortgage Type
FHA
Estimated Equity
$232,999
Purchase Details
Closed on
Mar 14, 2003
Sold by
Potter Ernest D and Potter Jessie B
Bought by
Potter Ernest D and Potter Linda
Purchase Details
Closed on
Jan 5, 2001
Sold by
Chamberlain Burt Allen
Bought by
Potter Ernest D and Potter Jessie B
Purchase Details
Closed on
Jan 2, 2001
Sold by
Chamberlain Don S
Bought by
Chamberlain Burt Allen
Purchase Details
Closed on
Jul 31, 1992
Sold by
Greene Robert F and Greene Katherine
Bought by
Chamberlain Don S
Purchase Details
Closed on
Aug 17, 1973
Bought by
Greene Robert F and Greene Katherine
Create a Home Valuation Report for This Property
The Home Valuation Report is an in-depth analysis detailing your home's value as well as a comparison with similar homes in the area
Home Values in the Area
Average Home Value in this Area
Purchase History
| Date | Buyer | Sale Price | Title Company |
|---|---|---|---|
| Didenko Andrey | $179,900 | -- | |
| Potter Ernest D | -- | -- | |
| Potter Ernest D | $25,000 | -- | |
| Chamberlain Burt Allen | -- | -- | |
| Chamberlain Don S | $8,000 | -- | |
| Greene Robert F | $5,000 | -- |
Source: Public Records
Mortgage History
| Date | Status | Borrower | Loan Amount |
|---|---|---|---|
| Open | Didenko Andrey | $175,339 |
Source: Public Records
Tax History
| Year | Tax Paid | Tax Assessment Tax Assessment Total Assessment is a certain percentage of the fair market value that is determined by local assessors to be the total taxable value of land and additions on the property. | Land | Improvement |
|---|---|---|---|---|
| 2024 | $2,548 | $112,746 | $4,800 | $107,946 |
| 2023 | $2,481 | $107,310 | $4,800 | $102,510 |
| 2022 | $2,359 | $93,564 | $4,800 | $88,764 |
| 2021 | $2,217 | $78,997 | $4,800 | $74,197 |
| 2020 | $1,905 | $64,436 | $4,800 | $59,636 |
| 2019 | $1,938 | $64,436 | $4,800 | $59,636 |
| 2018 | $1,705 | $64,436 | $4,800 | $59,636 |
| 2017 | $2,115 | $64,436 | $4,800 | $59,636 |
| 2016 | $1,707 | $64,436 | $4,800 | $59,636 |
| 2015 | $2,085 | $75,050 | $4,800 | $70,250 |
| 2014 | $1,958 | $75,050 | $4,800 | $70,250 |
| 2013 | -- | $75,050 | $4,800 | $70,250 |
Source: Public Records
Map
Nearby Homes
- 404 W Schmitt Rd
- 309 W Schmitt Rd
- 102 W Schmitt Rd
- 16 Japonica St
- 115 Crestline Dr
- 221 Highland Dr
- 86 West Dr
- 19 Turkey Run
- 52 Tower Dr
- 211 Elaine Dr
- 22 Carmack Rd
- 120 Williams Ave
- 3269 N Highway 341
- 130 Cascade Dr
- 125 Cascade Dr
- 228 Cascade Dr
- 270 Cascade Dr
- 152 Carmack Rd
- 33 Brumby Rd
- 433 Stanford Dr
Your Personal Tour Guide
Ask me questions while you tour the home.