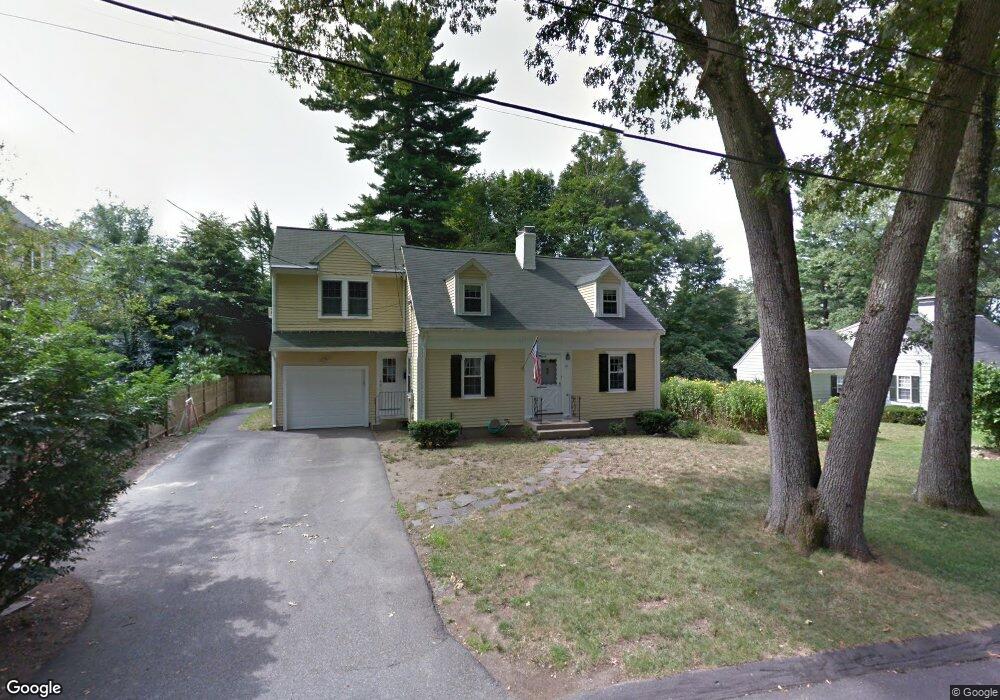
31 Fuller Rd Lexington, MA 02420
North Lexington NeighborhoodEstimated Value: $1,506,921 - $1,560,000
4
Beds
3
Baths
2,821
Sq Ft
$546/Sq Ft
Est. Value
About This Home
This home is located at 31 Fuller Rd, Lexington, MA 02420 and is currently estimated at $1,541,480, approximately $546 per square foot. 31 Fuller Rd is a home located in Middlesex County with nearby schools including Joseph Estabrook Elementary School, William Diamond Middle School, and Lexington High School.
Ownership History
Date
Name
Owned For
Owner Type
Purchase Details
Closed on
Jul 29, 2020
Sold by
Swift Diana G
Bought by
Swift Ft
Current Estimated Value
Purchase Details
Closed on
Nov 19, 2012
Sold by
Burton H Smith T
Bought by
31 Fuller Road Rt
Purchase Details
Closed on
Sep 7, 2010
Sold by
Smith Burton H
Bought by
Burton H Smith T
Purchase Details
Closed on
Aug 1, 1980
Bought by
Swift Diana G
Create a Home Valuation Report for This Property
The Home Valuation Report is an in-depth analysis detailing your home's value as well as a comparison with similar homes in the area
Home Values in the Area
Average Home Value in this Area
Purchase History
| Date | Buyer | Sale Price | Title Company |
|---|---|---|---|
| Swift Ft | -- | None Available | |
| Swift Diana G | -- | None Available | |
| 31 Fuller Road Rt | -- | -- | |
| Burton H Smith T | -- | -- | |
| Swift Diana G | -- | -- |
Source: Public Records
Tax History
| Year | Tax Paid | Tax Assessment Tax Assessment Total Assessment is a certain percentage of the fair market value that is determined by local assessors to be the total taxable value of land and additions on the property. | Land | Improvement |
|---|---|---|---|---|
| 2025 | $16,388 | $1,340,000 | $778,000 | $562,000 |
| 2024 | $15,962 | $1,303,000 | $741,000 | $562,000 |
| 2023 | $15,223 | $1,171,000 | $674,000 | $497,000 |
| 2022 | $14,587 | $1,057,000 | $612,000 | $445,000 |
| 2021 | $14,217 | $988,000 | $558,000 | $430,000 |
| 2020 | $13,881 | $988,000 | $558,000 | $430,000 |
| 2019 | $13,202 | $935,000 | $532,000 | $403,000 |
| 2018 | $12,784 | $894,000 | $506,000 | $388,000 |
| 2017 | $12,577 | $868,000 | $495,000 | $373,000 |
| 2016 | $13,009 | $891,000 | $451,000 | $440,000 |
| 2015 | $12,185 | $820,000 | $410,000 | $410,000 |
| 2014 | $9,399 | $606,000 | $373,000 | $233,000 |
Source: Public Records
Map
Nearby Homes
- 10 Dexter Rd
- 10 Preston Rd
- 63 Dexter Rd
- 109 Simonds Rd
- 9 Hillside Terrace
- 17 Hamilton Rd
- 18 Victory Garden Way
- 25 Flintlock Rd
- 18 Robinson Rd
- 24 Donald St
- 1 Revere St
- 18 Hill St
- 93 Bedford St Unit 101
- 93 Bedford St Unit 201
- 93 Bedford St Unit 308
- 93 Bedford St Unit 108
- 58 Hill St
- 4 Whittier Rd
- 79 Bedford St Unit 79
- 58 Hancock St
Your Personal Tour Guide
Ask me questions while you tour the home.