31 Garman Ln Midway, GA 31320
Estimated Value: $216,000 - $232,000
3
Beds
2
Baths
1,316
Sq Ft
$170/Sq Ft
Est. Value
About This Home
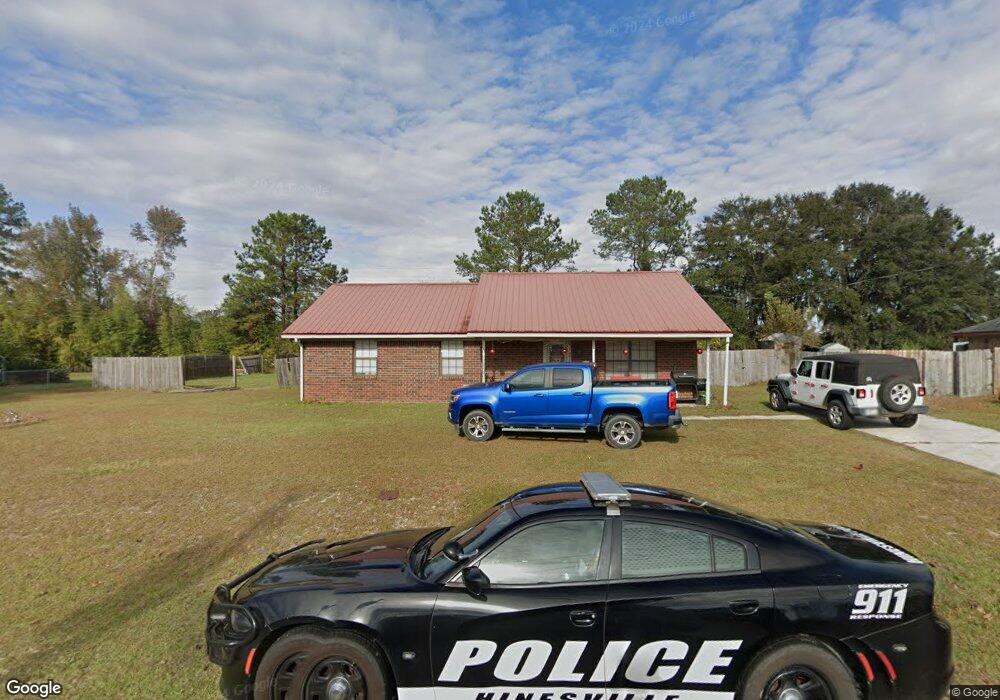
This home is located at 31 Garman Ln, Midway, GA 31320 and is currently estimated at $224,177, approximately $170 per square foot. 31 Garman Ln is a home located in Liberty County with nearby schools including Liberty Elementary School, Midway Middle School, and Liberty County High School.
Ownership History
Date
Name
Owned For
Owner Type
Purchase Details
Closed on
Dec 21, 2010
Sold by
Durfy Lindsey N
Bought by
Durfy Bryan A
Current Estimated Value
Purchase Details
Closed on
Feb 8, 2006
Sold by
Johnson Todd
Bought by
Durfy Bryan A and Durfy Lindsay N
Purchase Details
Closed on
Jul 2, 2004
Sold by
Secretary Of Veterans Affairs
Bought by
Johnson Phyllis and Johnson Todd
Purchase Details
Closed on
May 6, 2003
Sold by
Republic Bank
Bought by
Sec Of V A
Purchase Details
Closed on
Aug 14, 1997
Sold by
Henry Theresa J
Bought by
Green Alberto J
Purchase Details
Closed on
Nov 1, 1993
Bought by
Henry Theresa J
Purchase Details
Closed on
Jun 7, 1993
Bought by
Mccumber Jerry
Create a Home Valuation Report for This Property
The Home Valuation Report is an in-depth analysis detailing your home's value as well as a comparison with similar homes in the area
Home Values in the Area
Average Home Value in this Area
Purchase History
| Date | Buyer | Sale Price | Title Company |
|---|---|---|---|
| Durfy Bryan A | -- | -- | |
| Durfy Bryan A | $80,500 | -- | |
| Johnson Phyllis | $73,500 | -- | |
| Sec Of V A | $61,300 | -- | |
| Republic Bank | $61,300 | -- | |
| Green Alberto J | $62,400 | -- | |
| Henry Theresa J | $55,000 | -- | |
| Mccumber Jerry | -- | -- |
Source: Public Records
Tax History Compared to Growth
Tax History
| Year | Tax Paid | Tax Assessment Tax Assessment Total Assessment is a certain percentage of the fair market value that is determined by local assessors to be the total taxable value of land and additions on the property. | Land | Improvement |
|---|---|---|---|---|
| 2024 | $2,588 | $66,546 | $12,000 | $54,546 |
| 2023 | $2,588 | $59,959 | $12,000 | $47,959 |
| 2022 | $1,897 | $49,778 | $11,200 | $38,578 |
| 2021 | $1,714 | $45,180 | $11,200 | $33,980 |
| 2020 | $1,447 | $38,323 | $10,000 | $28,323 |
| 2019 | $1,427 | $38,693 | $10,000 | $28,693 |
| 2018 | $1,426 | $39,062 | $10,000 | $29,062 |
| 2017 | $1,395 | $42,372 | $10,000 | $32,372 |
| 2016 | $1,364 | $39,802 | $10,000 | $29,802 |
| 2015 | $1,435 | $39,802 | $10,000 | $29,802 |
| 2014 | $1,435 | $41,470 | $10,000 | $31,470 |
| 2013 | -- | $38,429 | $10,000 | $28,429 |
Source: Public Records
Map
Nearby Homes
- 9 Ashlynn Ln
- 0 E Oglethorpe Unit 10592168
- 0 E Oglethorpe Unit SA333651
- 0 E Oglethorpe Unit 153327
- 124 Denham Ln
- 124 Denham Ln
- 10 Katelynn Ln
- 266 River Bend Dr
- 327 River Bend Dr
- 90 Charleston Ct
- 0000 E Oglethorpe Hwy
- 182 Gloucester Dr
- 0 S Coastal Hwy
- 175 U S 17
- 984 Stone Ct
- 1123 Stone Ct
- 140 Kettle Creek Ln
- 307 Cottage Loop
- 177 Cottage Loop
- 62 Carver Way
- 9 Garman Ln
- 53 Garman Ln
- 26 Cross Creek Dr
- 24 Cross Creek Dr
- 14 Garman Ln
- 44 Garman Ln
- 75 Garman Ln
- 64 Garman Ln
- 30 Cross Creek Dr
- 16 Cross Creek Dr
- 56 Cross Creek Dr
- 76 Garman Ln
- 29 Ashlynn Ln
- 80 Cross Creek Dr
- 49 Ashlynn Ln
- 102 Cross Creek Dr
- 61 Ashlynn Ln
- 71 Edgewater Dr
- 126 Cross Creek Dr
- 16 Ashlynn Ln