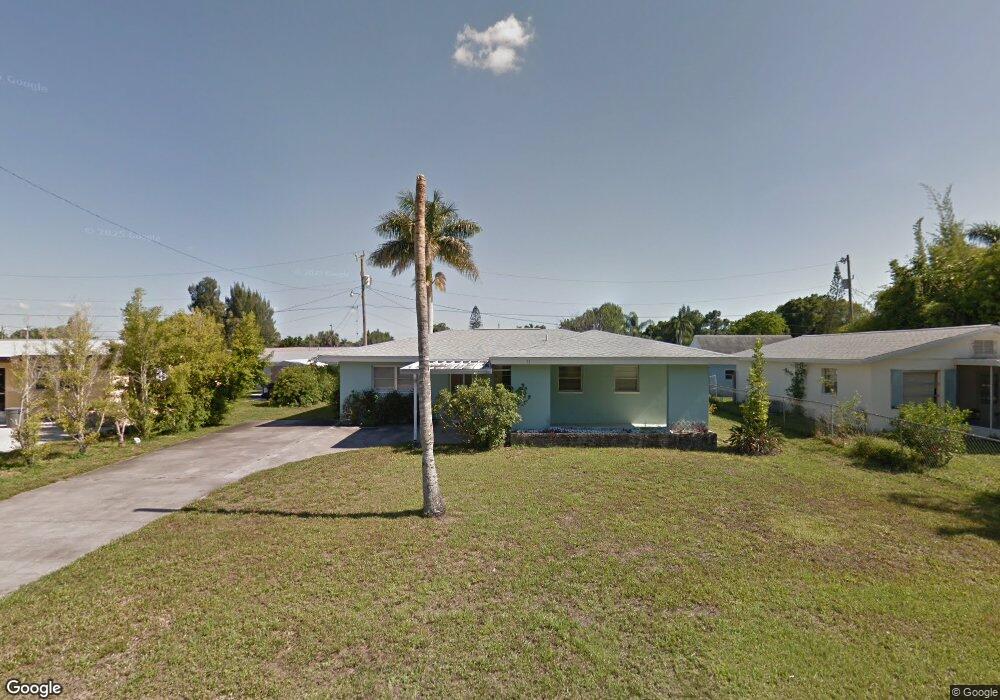
31 Glenmont Dr W North Fort Myers, FL 33917
Estimated Value: $163,000 - $215,000
3
Beds
2
Baths
1,050
Sq Ft
$181/Sq Ft
Est. Value
About This Home
This home is located at 31 Glenmont Dr W, North Fort Myers, FL 33917 and is currently estimated at $189,819, approximately $180 per square foot. 31 Glenmont Dr W is a home located in Lee County with nearby schools including J. Colin English Elementary School, Tropic Isles Elementary School, and Hancock Creek Elementary School.
Ownership History
Date
Name
Owned For
Owner Type
Purchase Details
Closed on
Apr 19, 2018
Sold by
Spoor Carol J
Bought by
Spoor Carol J and Spoor Lawerence G
Current Estimated Value
Home Financials for this Owner
Home Financials are based on the most recent Mortgage that was taken out on this home.
Original Mortgage
$127,678
Outstanding Balance
$109,801
Interest Rate
4.44%
Mortgage Type
VA
Estimated Equity
$80,018
Purchase Details
Closed on
Aug 3, 2011
Sold by
Todd Truman L
Bought by
Spoor Carol J
Home Financials for this Owner
Home Financials are based on the most recent Mortgage that was taken out on this home.
Original Mortgage
$56,358
Interest Rate
4.5%
Mortgage Type
FHA
Purchase Details
Closed on
Jul 11, 2000
Sold by
Jochem Ingo Dieter
Bought by
Todd Truman L
Purchase Details
Closed on
Apr 9, 1998
Sold by
Jochem Ingo Dieter and Jochem Ingo
Bought by
Jochem Ingo Dieter
Create a Home Valuation Report for This Property
The Home Valuation Report is an in-depth analysis detailing your home's value as well as a comparison with similar homes in the area
Home Values in the Area
Average Home Value in this Area
Purchase History
| Date | Buyer | Sale Price | Title Company |
|---|---|---|---|
| Spoor Carol J | $35,200 | Amrock | |
| Spoor Carol J | $58,000 | Stewart Title Company | |
| Todd Truman L | $53,000 | -- | |
| Jochem Ingo Dieter | -- | -- |
Source: Public Records
Mortgage History
| Date | Status | Borrower | Loan Amount |
|---|---|---|---|
| Open | Spoor Carol J | $127,678 | |
| Previous Owner | Spoor Carol J | $56,358 |
Source: Public Records
Tax History Compared to Growth
Tax History
| Year | Tax Paid | Tax Assessment Tax Assessment Total Assessment is a certain percentage of the fair market value that is determined by local assessors to be the total taxable value of land and additions on the property. | Land | Improvement |
|---|---|---|---|---|
| 2025 | $695 | $51,083 | -- | -- |
| 2024 | $695 | $49,643 | -- | -- |
| 2023 | $659 | $48,197 | $0 | $0 |
| 2022 | $734 | $46,793 | $0 | $0 |
| 2021 | $670 | $107,969 | $10,798 | $97,171 |
| 2020 | $661 | $44,803 | $0 | $0 |
| 2019 | $637 | $43,796 | $0 | $0 |
| 2018 | $629 | $42,979 | $0 | $0 |
| 2017 | $614 | $42,095 | $0 | $0 |
| 2016 | $552 | $66,579 | $6,220 | $60,359 |
| 2015 | $545 | $59,697 | $4,893 | $54,804 |
| 2014 | -- | $44,102 | $3,909 | $40,193 |
| 2013 | -- | $42,698 | $3,524 | $39,174 |
Source: Public Records
Map
Nearby Homes
- 61 Glenmont Dr W
- 89 Glenmont Dr W
- 190 Brooks Rd
- 158 Dow Ln
- 134 Powell Creek Cir
- 1309 Evalena Ln
- 240 E Mariana Ave
- 134,138 Powell Creek Cir
- 108 Powell Creek Cir
- 1358 Sunrise Dr
- 1398 Harbor View Dr
- 93 E Mariana Ave
- 195 E Mariana Ave
- 1370 Harbor View Dr
- 330 Bamboo Dr
- 1616 Daniels Dr
- 1370 Lavin Ln
- 1330-1336-1336 Lavin Ln
- 1320 Lavin Ln
- 21 E Mariana Ave
- 33 Glenmont Dr W
- 29 Glenmont Dr W
- 48 Victoria Dr
- 20 Glenmont Dr W
- 42 Victoria Dr
- 25 Glenmont Dr W
- 18 Glenmont Dr W
- 22 Glenmont Dr W
- 40 Victoria Dr
- 21 Glenmont Dr W
- 62 Glenmont Dr W
- 62 Victoria Dr
- 30 Victoria Dr
- 53 Victoria Dr
- 15 Glenmont Dr W
- 68 Victoria Dr
- 41 Victoria Dr
- 68 Glenmont Dr W
- 55 Victoria Dr
- 24 Victoria Dr