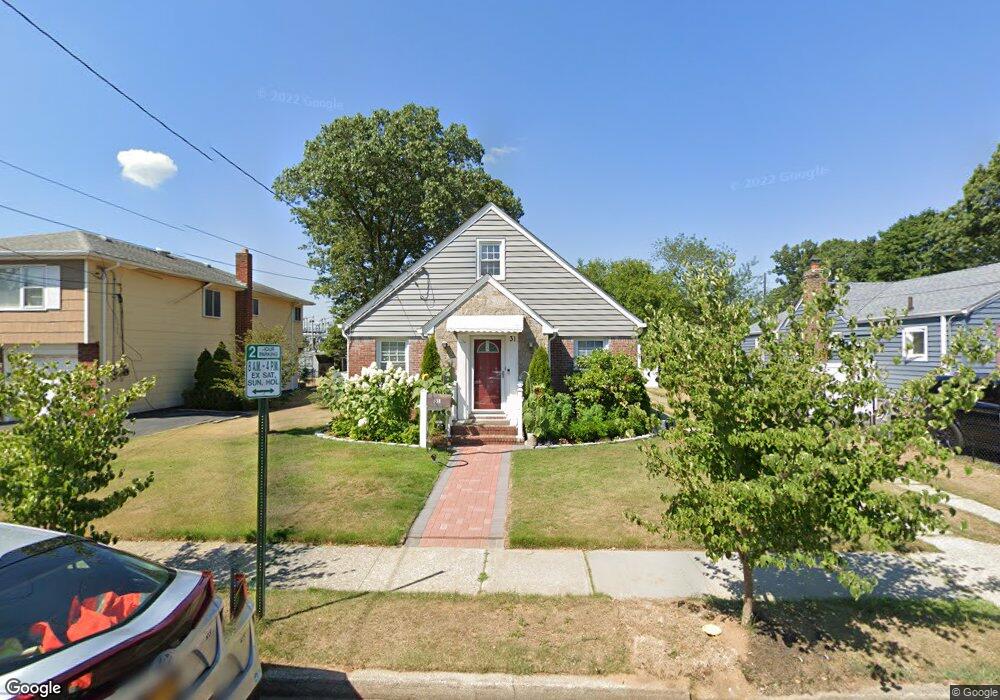
31 Grand Ave Lynbrook, NY 11563
Estimated Value: $672,000 - $766,754
3
Beds
1
Bath
1,379
Sq Ft
$522/Sq Ft
Est. Value
About This Home
This home is located at 31 Grand Ave, Lynbrook, NY 11563 and is currently estimated at $719,377, approximately $521 per square foot. 31 Grand Ave is a home located in Nassau County with nearby schools including Lynbrook Senior High School, Our Lady Of Peace School, and Holy Name of Mary School.
Ownership History
Date
Name
Owned For
Owner Type
Purchase Details
Closed on
Jan 25, 2017
Sold by
Gallagher Mary
Bought by
Sherpa Deenesh and Lama Sangay
Current Estimated Value
Home Financials for this Owner
Home Financials are based on the most recent Mortgage that was taken out on this home.
Original Mortgage
$372,600
Outstanding Balance
$308,057
Interest Rate
4.32%
Mortgage Type
New Conventional
Estimated Equity
$411,320
Purchase Details
Closed on
Dec 21, 2007
Sold by
Bottijiliso Joseph
Bought by
Gallagher Mary
Purchase Details
Closed on
Mar 25, 2004
Sold by
Kostyshyn Maurice
Bought by
Bottijliso Leslie
Purchase Details
Closed on
Nov 29, 1996
Create a Home Valuation Report for This Property
The Home Valuation Report is an in-depth analysis detailing your home's value as well as a comparison with similar homes in the area
Home Values in the Area
Average Home Value in this Area
Purchase History
| Date | Buyer | Sale Price | Title Company |
|---|---|---|---|
| Sherpa Deenesh | $414,000 | None Available | |
| Sherpa Deenesh | $414,000 | None Available | |
| Sherpa Deenesh | $414,000 | None Available | |
| Gallagher Mary | $430,000 | -- | |
| Gallagher Mary | $430,000 | -- | |
| Bottijliso Leslie | $220,000 | -- | |
| Bottijliso Leslie | $220,000 | -- | |
| -- | -- | -- | |
| -- | -- | -- |
Source: Public Records
Mortgage History
| Date | Status | Borrower | Loan Amount |
|---|---|---|---|
| Open | Sherpa Deenesh | $372,600 | |
| Closed | Sherpa Deenesh | $372,600 |
Source: Public Records
Tax History Compared to Growth
Tax History
| Year | Tax Paid | Tax Assessment Tax Assessment Total Assessment is a certain percentage of the fair market value that is determined by local assessors to be the total taxable value of land and additions on the property. | Land | Improvement |
|---|---|---|---|---|
| 2025 | $10,244 | $444 | $240 | $204 |
| 2024 | $1,027 | $479 | $259 | $220 |
| 2023 | $10,713 | $504 | $273 | $231 |
| 2022 | $10,713 | $479 | $259 | $220 |
| 2021 | $14,188 | $491 | $266 | $225 |
| 2020 | $9,756 | $580 | $447 | $133 |
| 2019 | $8,975 | $639 | $493 | $146 |
| 2018 | $9,640 | $639 | $0 | $0 |
| 2017 | $5,379 | $639 | $493 | $146 |
| 2016 | $6,186 | $639 | $423 | $216 |
| 2015 | $829 | $639 | $423 | $216 |
| 2014 | $829 | $639 | $423 | $216 |
| 2013 | $886 | $745 | $493 | $252 |
Source: Public Records
Map
Nearby Homes
- 241 Hendrickson Ave
- 149 Foster Ave
- 263 Foster Ave
- 56 Whittier St
- 67 Burtis St
- 95 Foster Ave
- 145 Cornwell Ave
- 60 Harvard Ave
- 33 Marshall Ave
- 200 E Euclid St
- 35 Carlton St
- 232 Sherman St
- 207 Motley St
- 139 E Maujer St
- 97 E Beverly Pkwy
- 11 Walker St
- 33 Cleveland St
- 57 Carol St
- 313 Emerson Place
- 216 Home St