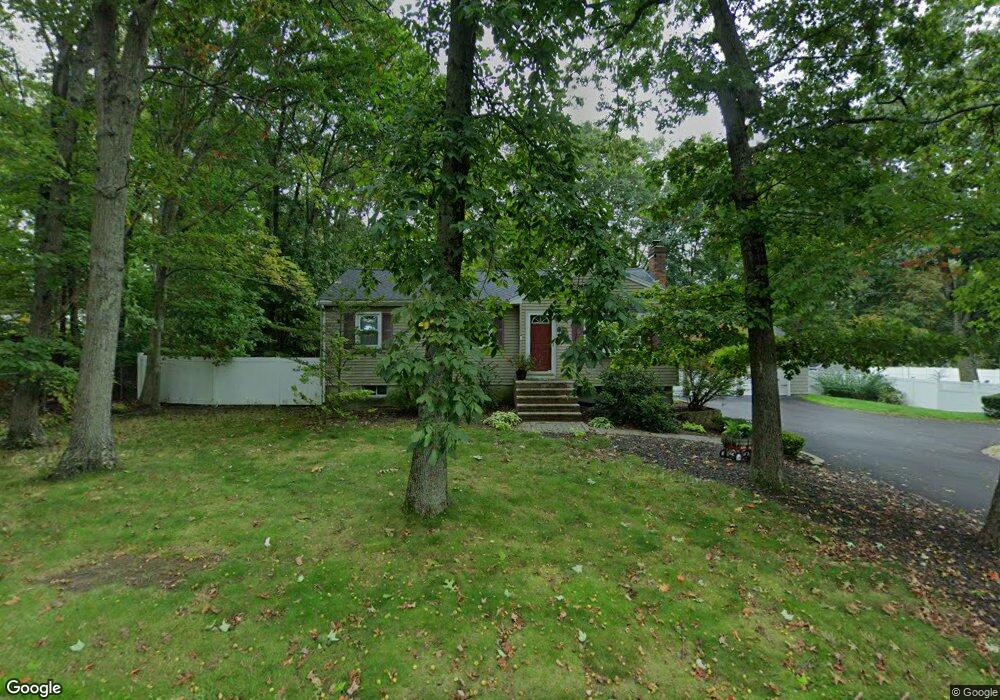
31 Green St Foxboro, MA 02035
Estimated Value: $587,099 - $651,000
3
Beds
3
Baths
1,396
Sq Ft
$444/Sq Ft
Est. Value
About This Home
This home is located at 31 Green St, Foxboro, MA 02035 and is currently estimated at $620,025, approximately $444 per square foot. 31 Green St is a home located in Norfolk County with nearby schools including Foxborough High School, Foxborough Regional Charter School, and St Mary's Catholic School.
Ownership History
Date
Name
Owned For
Owner Type
Purchase Details
Closed on
Jul 22, 2025
Sold by
Cirino Steven and Cirino Laura J
Bought by
One Green St Rt and Cirino
Current Estimated Value
Purchase Details
Closed on
Jun 27, 1997
Sold by
Reed David A
Bought by
Cirino Steven and Cirino Laura
Home Financials for this Owner
Home Financials are based on the most recent Mortgage that was taken out on this home.
Original Mortgage
$141,900
Interest Rate
7.81%
Mortgage Type
Purchase Money Mortgage
Purchase Details
Closed on
Jan 28, 1992
Sold by
Tarkka Robert C
Bought by
Reed David A
Create a Home Valuation Report for This Property
The Home Valuation Report is an in-depth analysis detailing your home's value as well as a comparison with similar homes in the area
Home Values in the Area
Average Home Value in this Area
Purchase History
| Date | Buyer | Sale Price | Title Company |
|---|---|---|---|
| One Green St Rt | -- | -- | |
| One Green St Rt | -- | -- | |
| Cirino Steven | $156,800 | -- | |
| Cirino Steven | $156,800 | -- | |
| Reed David A | $140,000 | -- | |
| Reed David A | $140,000 | -- |
Source: Public Records
Mortgage History
| Date | Status | Borrower | Loan Amount |
|---|---|---|---|
| Previous Owner | Reed David A | $220,000 | |
| Previous Owner | Reed David A | $144,000 | |
| Previous Owner | Reed David A | $141,900 |
Source: Public Records
Tax History Compared to Growth
Tax History
| Year | Tax Paid | Tax Assessment Tax Assessment Total Assessment is a certain percentage of the fair market value that is determined by local assessors to be the total taxable value of land and additions on the property. | Land | Improvement |
|---|---|---|---|---|
| 2025 | $5,859 | $443,200 | $184,800 | $258,400 |
| 2024 | $6,084 | $450,300 | $217,400 | $232,900 |
| 2023 | $5,637 | $396,700 | $207,000 | $189,700 |
| 2022 | $5,433 | $374,200 | $180,000 | $194,200 |
| 2021 | $5,099 | $345,900 | $162,000 | $183,900 |
| 2020 | $4,846 | $332,600 | $162,000 | $170,600 |
| 2019 | $4,714 | $320,700 | $154,300 | $166,400 |
| 2018 | $4,585 | $314,700 | $154,300 | $160,400 |
| 2017 | $4,581 | $304,600 | $160,200 | $144,400 |
| 2016 | $3,924 | $264,800 | $117,400 | $147,400 |
| 2015 | $3,911 | $257,500 | $107,200 | $150,300 |
| 2014 | $3,905 | $260,500 | $107,200 | $153,300 |
Source: Public Records
Map
Nearby Homes
- 406 South St
- 24 Maverick Dr
- 16 Treasure Island Rd
- 80 Mill St
- 450 West St
- 4 Buckskin Dr
- 9 Oak Dr
- 356 Central St
- 116 George St
- 47 Old Farm Rd
- 166 Chauncy St
- 150 Gilbert St
- 12 Spring St
- 231 Spring St
- 126 Washington St
- 130 Washington St
- 124 Washington St
- 483 Thurston St
- 158 Washington St
- 28 Messenger St