J
Seller's Agent in 2017
Johnny Ho
Kava Realty Group, Inc.
(781) 308-7355
23 Total Sales
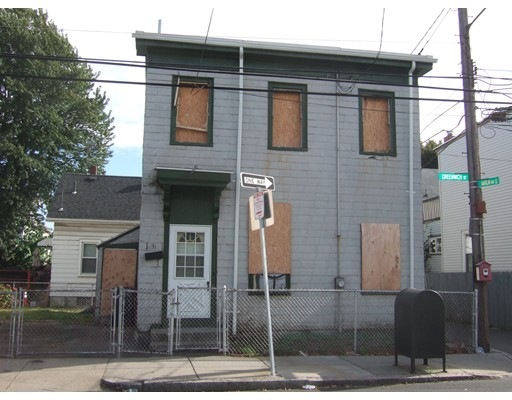
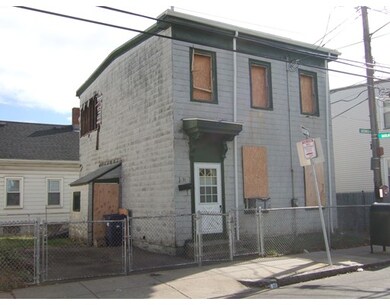
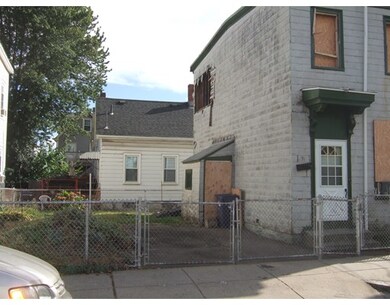
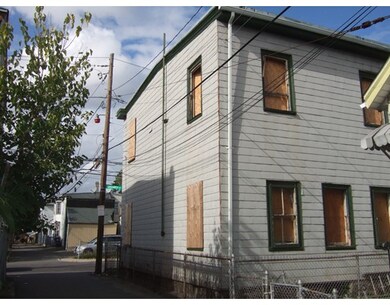
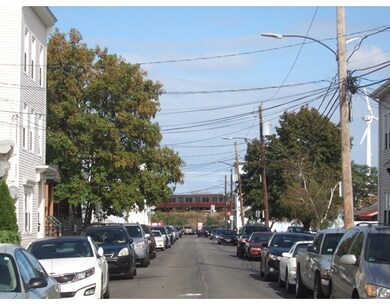
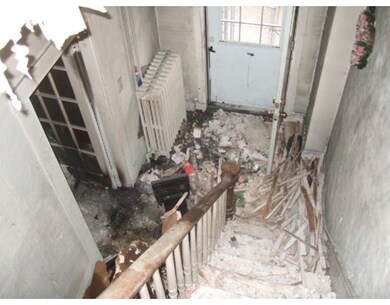
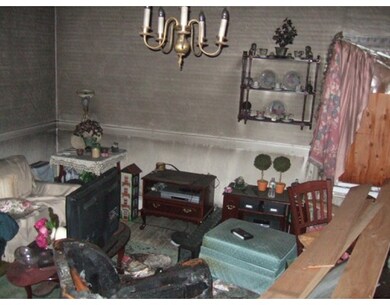
Great Investor/Contractor Opportunity. Single Family Colonial House with Driveway and Fenced Yard in Thriving Fields Corner Neighborhood. Walk to Shopping, Restaurants, Coffee, Pubs, Conveniences, UMASS, Fields Corner or Savin Hill T Stations...8 Minute Ride to Downtown Boston. 3 Min to I-93. House fire in January 2015. Property being Sold in, "AS IS" Condition. Broker and Seller make No representation regarding the condition of this property. Buyer is responsible for doing Own Due Diligence. Bring Flashlight.
Home Type
Single Family
Est. Annual Taxes
$7,891
Year Built
1870
Lot Details
0
| Date | Type | Sale Price | Title Company |
|---|---|---|---|
| Not Resolvable | $539,000 | -- | |
| Not Resolvable | $215,000 | -- | |
| Deed | $95,000 | -- |
| Date | Status | Loan Amount | Loan Type |
|---|---|---|---|
| Open | $462,000 | Stand Alone Refi Refinance Of Original Loan | |
| Closed | $485,100 | New Conventional | |
| Previous Owner | $76,000 | Purchase Money Mortgage | |
| Closed | $4,750 | No Value Available |
| Date | Event | Price | Change | Sq Ft Price |
|---|---|---|---|---|
| 06/26/2017 06/26/17 | Sold | $539,000 | 0.0% | $408 / Sq Ft |
| 05/01/2017 05/01/17 | Pending | -- | -- | -- |
| 04/19/2017 04/19/17 | For Sale | $539,000 | +150.7% | $408 / Sq Ft |
| 05/26/2016 05/26/16 | Sold | $215,000 | 0.0% | $163 / Sq Ft |
| 05/02/2016 05/02/16 | Pending | -- | -- | -- |
| 05/01/2016 05/01/16 | Off Market | $215,000 | -- | -- |
| 01/17/2016 01/17/16 | Pending | -- | -- | -- |
| 01/15/2016 01/15/16 | Off Market | $215,000 | -- | -- |
| 11/10/2015 11/10/15 | Pending | -- | -- | -- |
| 09/29/2015 09/29/15 | For Sale | $269,000 | -- | $204 / Sq Ft |
| Year | Tax Paid | Tax Assessment Tax Assessment Total Assessment is a certain percentage of the fair market value that is determined by local assessors to be the total taxable value of land and additions on the property. | Land | Improvement |
|---|---|---|---|---|
| 2025 | $7,891 | $681,400 | $139,900 | $541,500 |
| 2024 | $6,629 | $608,200 | $139,400 | $468,800 |
| 2023 | $6,106 | $568,500 | $130,300 | $438,200 |
| 2022 | $5,673 | $521,400 | $119,500 | $401,900 |
| 2021 | $5,123 | $480,100 | $113,800 | $366,300 |
| 2020 | $4,934 | $467,200 | $115,500 | $351,700 |
| 2019 | $4,561 | $432,740 | $92,620 | $340,120 |
| 2018 | $3,485 | $332,500 | $84,200 | $248,300 |
| 2017 | $1,401 | $132,336 | $60,624 | $71,712 |
| 2016 | $1,944 | $176,700 | $84,200 | $92,500 |
| 2015 | $2,038 | $168,300 | $68,900 | $99,400 |
| 2014 | $1,960 | $155,800 | $68,900 | $86,900 |
J
Seller's Agent in 2017
Johnny Ho
Kava Realty Group, Inc.
(781) 308-7355
23 Total Sales
M
Buyer's Agent in 2017
Michael Alberti
Vesta Real Estate Group, Inc.
J
Seller's Agent in 2016
James Silva
At Home Real Estate Group, Inc
(617) 436-7676
2 in this area
28 Total Sales
D
Buyer's Agent in 2016
Duc Ha
Duke & Co. Realty Advisors
(617) 916-9279
1 in this area
12 Total Sales
Source: MLS Property Information Network (MLS PIN)
MLS Number: 71912542
APN: DORC-000000-000015-000177
Disclaimer: Certain information contained herein is derived from information provided by parties other than Homes.com. All information provided is deemed reliable, but is not guaranteed to be accurate and should be independently verified.
![]() The property listing data and information, or the Images, set forth herein were provided to MLS Property Information Network, Inc. from third party sources, including sellers, lessors and public records, and were compiled by MLS Property Information Network, Inc. The property listing data and information, and the Images, are for the personal, non-commercial use of consumers having a good faith interest in purchasing or leasing listed properties of the type displayed to them and may not be used for any purpose other than to identify prospective properties which such consumers may have a good faith interest in purchasing or leasing. MLS Property Information Network, Inc. and its subscribers disclaim any and all representations and warranties as to the accuracy of the property listing data and information, or as to the accuracy of any of the Images, set forth herein.
The property listing data and information, or the Images, set forth herein were provided to MLS Property Information Network, Inc. from third party sources, including sellers, lessors and public records, and were compiled by MLS Property Information Network, Inc. The property listing data and information, and the Images, are for the personal, non-commercial use of consumers having a good faith interest in purchasing or leasing listed properties of the type displayed to them and may not be used for any purpose other than to identify prospective properties which such consumers may have a good faith interest in purchasing or leasing. MLS Property Information Network, Inc. and its subscribers disclaim any and all representations and warranties as to the accuracy of the property listing data and information, or as to the accuracy of any of the Images, set forth herein.
