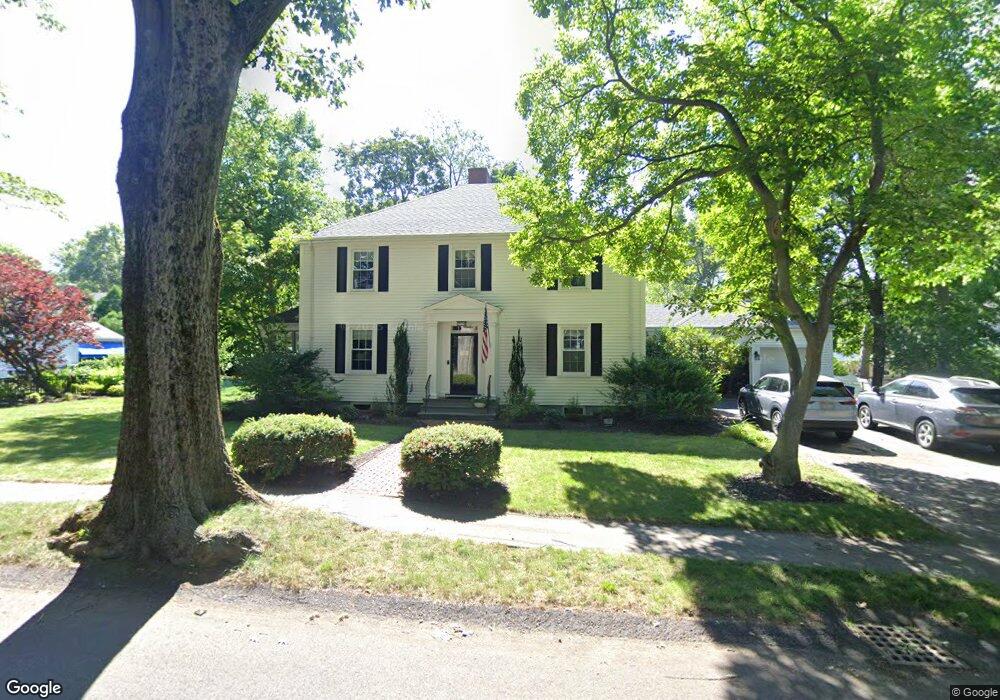
31 Grenwold Rd Quincy, MA 02169
Quincy Center NeighborhoodEstimated Value: $1,002,076 - $1,221,000
4
Beds
3
Baths
2,368
Sq Ft
$477/Sq Ft
Est. Value
About This Home
This home is located at 31 Grenwold Rd, Quincy, MA 02169 and is currently estimated at $1,129,519, approximately $476 per square foot. 31 Grenwold Rd is a home located in Norfolk County with nearby schools including Charles A. Bernazzani Elementary School, Central Middle School, and Quincy High School.
Ownership History
Date
Name
Owned For
Owner Type
Purchase Details
Closed on
Jan 21, 2020
Sold by
Nancy Kelly and Nancy Thomas F
Bought by
Kelly Ft
Current Estimated Value
Purchase Details
Closed on
Jul 1, 1983
Bought by
Kelly Thomas F
Create a Home Valuation Report for This Property
The Home Valuation Report is an in-depth analysis detailing your home's value as well as a comparison with similar homes in the area
Home Values in the Area
Average Home Value in this Area
Purchase History
| Date | Buyer | Sale Price | Title Company |
|---|---|---|---|
| Kelly Ft | -- | None Available | |
| Kelly Thomas F | -- | -- |
Source: Public Records
Mortgage History
| Date | Status | Borrower | Loan Amount |
|---|---|---|---|
| Previous Owner | Kelly Thomas F | $150,000 | |
| Previous Owner | Kelly Thomas F | $255,000 | |
| Previous Owner | Kelly Thomas F | $225,000 | |
| Previous Owner | Kelly Thomas F | $212,000 |
Source: Public Records
Tax History
| Year | Tax Paid | Tax Assessment Tax Assessment Total Assessment is a certain percentage of the fair market value that is determined by local assessors to be the total taxable value of land and additions on the property. | Land | Improvement |
|---|---|---|---|---|
| 2025 | $9,771 | $847,400 | $317,000 | $530,400 |
| 2024 | $9,265 | $822,100 | $302,400 | $519,700 |
| 2023 | $8,449 | $759,100 | $275,800 | $483,300 |
| 2022 | $8,617 | $719,300 | $251,600 | $467,700 |
| 2021 | $8,517 | $701,600 | $251,600 | $450,000 |
| 2020 | $8,593 | $691,300 | $240,000 | $451,300 |
| 2019 | $8,247 | $657,100 | $227,000 | $430,100 |
| 2018 | $8,327 | $624,200 | $227,000 | $397,200 |
| 2017 | $8,390 | $592,100 | $216,700 | $375,400 |
| 2016 | $7,960 | $554,300 | $206,800 | $347,500 |
| 2015 | $7,668 | $525,200 | $206,800 | $318,400 |
| 2014 | $7,323 | $492,800 | $197,400 | $295,400 |
Source: Public Records
Map
Nearby Homes
- 72 Oakland Ave
- 45 Oval Rd Unit 34
- 999 Hancock St Unit 402
- 165 Whitwell St
- 149 Reservoir Rd
- 1025 Hancock St Unit 11M
- 100 Grand View Ave Unit 9C
- 915 Hancock St Unit 2
- 163 Clay St Unit 3
- 20 Whitney Rd Unit 7
- 20 Whitney Rd Unit 1
- 59 Packards Ln Unit 5
- 59 Packards Ln Unit 1
- 59 Packards Ln Unit 3
- 40 Cross St Unit 1
- 52 Packards Ln Unit 4
- 39 Cross St
- 195 Thomas Burgin Pkwy Unit 212
- 195 Thomas Burgin Pkwy Unit 301
- 44 Armory St
Your Personal Tour Guide
Ask me questions while you tour the home.