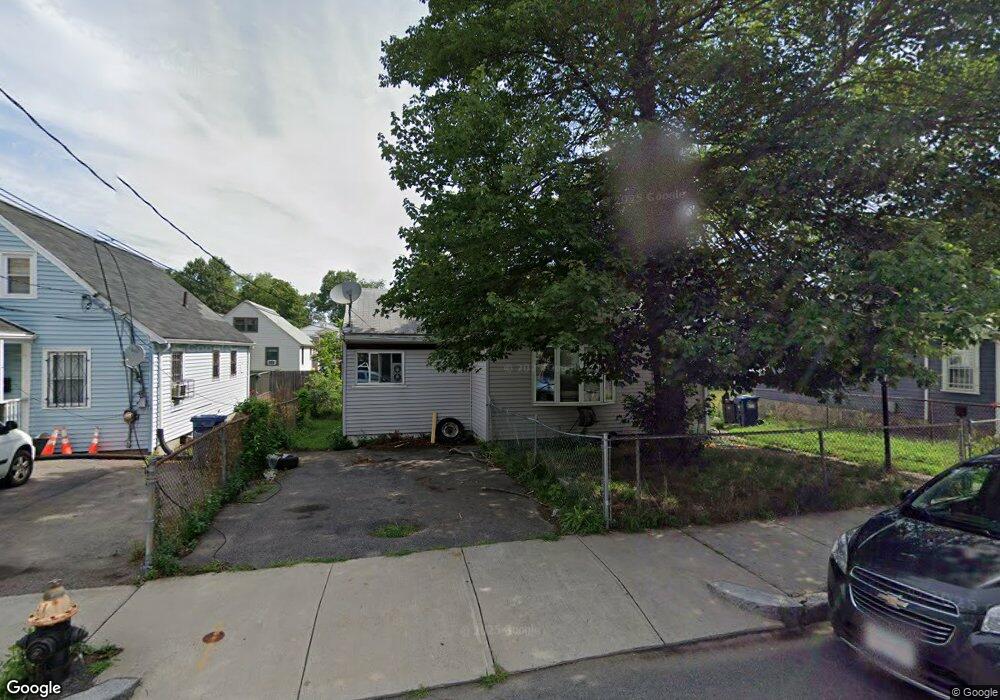
31 Halborn St Mattapan, MA 02126
Southern Mattapan NeighborhoodEstimated Value: $498,000 - $565,951
3
Beds
1
Bath
1,044
Sq Ft
$512/Sq Ft
Est. Value
About This Home
This home is located at 31 Halborn St, Mattapan, MA 02126 and is currently estimated at $534,738, approximately $512 per square foot. 31 Halborn St is a home located in Suffolk County with nearby schools including KIPP Academy Boston Charter School and Berea Seventh-day Adventist Academy.
Ownership History
Date
Name
Owned For
Owner Type
Purchase Details
Closed on
Jul 23, 1990
Sold by
Stewart William Est
Bought by
Thornton Tyrone
Current Estimated Value
Home Financials for this Owner
Home Financials are based on the most recent Mortgage that was taken out on this home.
Original Mortgage
$80,700
Interest Rate
9.94%
Mortgage Type
Purchase Money Mortgage
Create a Home Valuation Report for This Property
The Home Valuation Report is an in-depth analysis detailing your home's value as well as a comparison with similar homes in the area
Home Values in the Area
Average Home Value in this Area
Purchase History
| Date | Buyer | Sale Price | Title Company |
|---|---|---|---|
| Thornton Tyrone | $42,500 | -- | |
| Thornton Tyrone | $42,500 | -- |
Source: Public Records
Mortgage History
| Date | Status | Borrower | Loan Amount |
|---|---|---|---|
| Open | Thornton Tyrone | $107,000 | |
| Closed | Thornton Tyrone | $81,300 | |
| Closed | Thornton Tyrone | $80,700 |
Source: Public Records
Tax History Compared to Growth
Tax History
| Year | Tax Paid | Tax Assessment Tax Assessment Total Assessment is a certain percentage of the fair market value that is determined by local assessors to be the total taxable value of land and additions on the property. | Land | Improvement |
|---|---|---|---|---|
| 2025 | $4,217 | $364,200 | $127,800 | $236,400 |
| 2024 | $3,796 | $348,300 | $132,100 | $216,200 |
| 2023 | $3,562 | $331,700 | $125,800 | $205,900 |
| 2022 | $3,405 | $313,000 | $118,700 | $194,300 |
| 2021 | $3,281 | $307,500 | $118,700 | $188,800 |
| 2020 | $2,867 | $271,500 | $114,500 | $157,000 |
| 2019 | $2,675 | $253,800 | $87,900 | $165,900 |
| 2018 | $2,486 | $237,200 | $87,900 | $149,300 |
| 2017 | $2,487 | $234,800 | $87,900 | $146,900 |
| 2016 | $2,246 | $204,200 | $87,900 | $116,300 |
| 2015 | $1,863 | $153,800 | $84,500 | $69,300 |
| 2014 | $1,806 | $143,600 | $84,500 | $59,100 |
Source: Public Records
Map
Nearby Homes
- 11 French St
- 4 Crossman St Unit 4
- 22 Babson St
- 567B Norfolk St
- 71 Astoria St
- 98 Babson St
- 1465 Blue Hill Ave
- 31 Evelyn St
- 710 Walk Hill St
- 71 W Selden St Unit 3
- 24 Constitution Rd
- 64 Clarkwood St Unit 3
- 45 1st Ave Unit 111
- 10 Briarcliff Terrace
- 30 Glenhill Rd
- 18 Hosmer St
- 49 Fottler Rd
- 10 Hosmer St
- 116 Almont St
- 5 Sutton St
- 35 Halborn St
- 27 Halborn St
- 24 Rich St
- 39 Halborn St
- 26 Rich St
- 25 Halborn St
- 22 Rich St
- 28 Rich St
- 20 Rich St
- 34 Halborn St
- 30 Halborn St
- 174 Delhi St
- 19-21 Halborn St
- 19 Halborn St Unit 21
- 26 Halborn St Unit 28
- 26 Halborn St
- 18 Rich St
- 22 Halborn St Unit 24
- 15 Halborn St Unit 17
- 163 Delhi St Unit 3