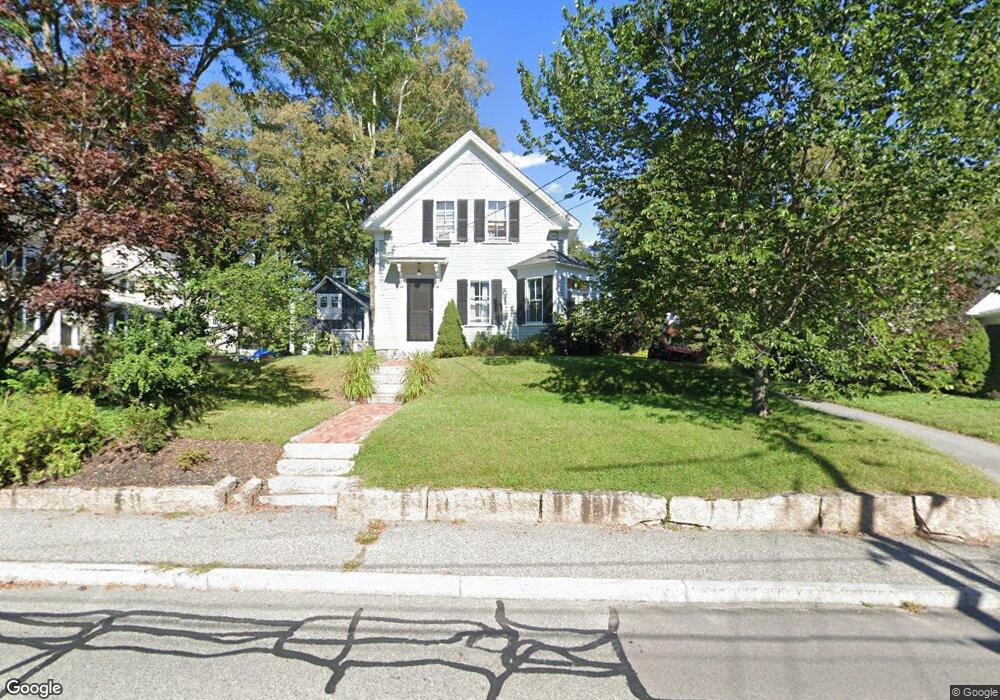
31 High St Holliston, MA 01746
Estimated Value: $610,000 - $664,321
3
Beds
2
Baths
1,629
Sq Ft
$398/Sq Ft
Est. Value
About This Home
This home is located at 31 High St, Holliston, MA 01746 and is currently estimated at $648,330, approximately $397 per square foot. 31 High St is a home located in Middlesex County with nearby schools including Placentino Elementary School, Miller Elementary School, and Robert H. Adams Middle School.
Ownership History
Date
Name
Owned For
Owner Type
Purchase Details
Closed on
Aug 2, 2018
Sold by
Sullivan John and Bergen-Sullivan Kimberly
Bought by
Sullivan Ft
Current Estimated Value
Purchase Details
Closed on
Dec 30, 1999
Sold by
Carey Gregory B and Carey Winifred M
Bought by
Sullivan John and Sullivan Kimberly B
Home Financials for this Owner
Home Financials are based on the most recent Mortgage that was taken out on this home.
Original Mortgage
$231,900
Interest Rate
7.71%
Mortgage Type
Purchase Money Mortgage
Create a Home Valuation Report for This Property
The Home Valuation Report is an in-depth analysis detailing your home's value as well as a comparison with similar homes in the area
Home Values in the Area
Average Home Value in this Area
Purchase History
| Date | Buyer | Sale Price | Title Company |
|---|---|---|---|
| Sullivan Ft | -- | -- | |
| Sullivan John | $289,900 | -- |
Source: Public Records
Mortgage History
| Date | Status | Borrower | Loan Amount |
|---|---|---|---|
| Previous Owner | Sullivan John | $280,000 | |
| Previous Owner | Sullivan John | $231,900 | |
| Previous Owner | Sullivan John | $131,500 |
Source: Public Records
Tax History Compared to Growth
Tax History
| Year | Tax Paid | Tax Assessment Tax Assessment Total Assessment is a certain percentage of the fair market value that is determined by local assessors to be the total taxable value of land and additions on the property. | Land | Improvement |
|---|---|---|---|---|
| 2025 | $8,731 | $596,000 | $250,000 | $346,000 |
| 2024 | $8,275 | $549,500 | $250,000 | $299,500 |
| 2023 | $7,471 | $485,100 | $208,600 | $276,500 |
| 2022 | $7,731 | $444,800 | $208,600 | $236,200 |
| 2021 | $7,802 | $437,100 | $200,900 | $236,200 |
| 2020 | $6,335 | $336,100 | $197,700 | $138,400 |
| 2019 | $6,125 | $325,300 | $172,000 | $153,300 |
| 2018 | $6,073 | $325,300 | $172,000 | $153,300 |
| 2017 | $5,978 | $322,800 | $165,200 | $157,600 |
| 2016 | $6,065 | $322,800 | $165,200 | $157,600 |
| 2015 | $5,467 | $282,100 | $129,300 | $152,800 |
Source: Public Records
Map
Nearby Homes
- 56 Roy Ave
- 62 Carl Rd
- 6 Westfield Dr
- 3 Danforth Dr
- 13 Temi Rd
- 52 Jasper Hill Rd
- 104 Brooksmont Dr Unit 104
- 43 Bittersweet Cir Unit 43
- 19 Southfield Ln
- 19 Southfield Ln Unit 19
- 175 Westfield Dr
- 1366 Washington St
- 6 Brook St
- 65 Wingate Rd
- 9 Ruth Ellen Rd
- 62 Ashland St
- 58 Front St
- 10 Ward Ln
- 38 Turner Rd
- 485 Central St