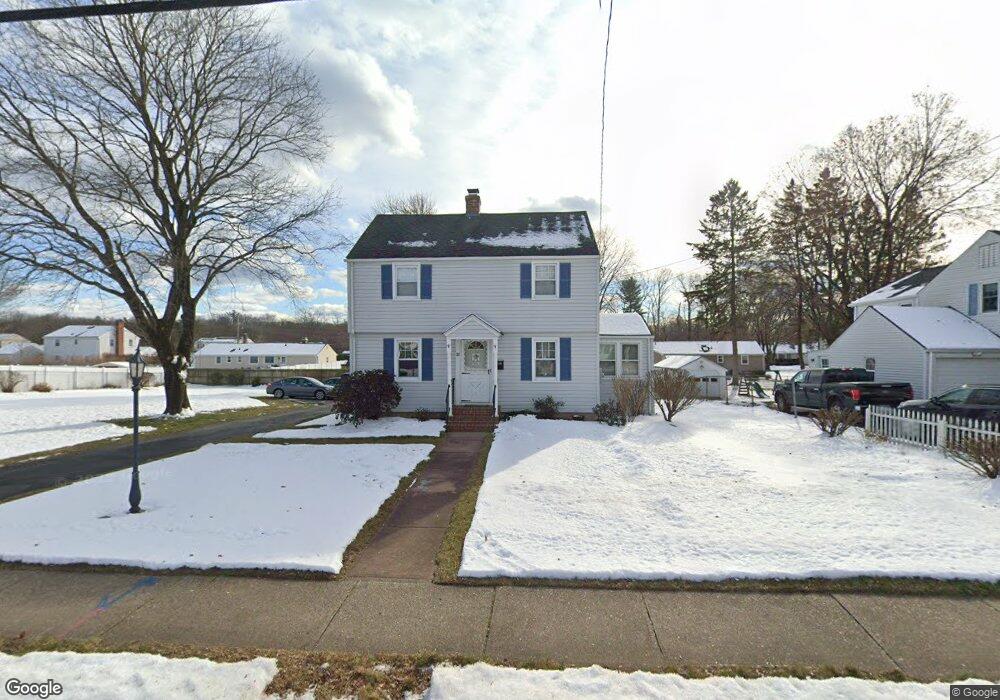
31 Hills St East Hartford, CT 06118
Estimated Value: $326,000 - $369,000
4
Beds
2
Baths
1,682
Sq Ft
$205/Sq Ft
Est. Value
About This Home
This home is located at 31 Hills St, East Hartford, CT 06118 and is currently estimated at $344,166, approximately $204 per square foot. 31 Hills St is a home located in Hartford County with nearby schools including Joseph O. Goodwin School, East Hartford Middle School, and East Hartford High School.
Ownership History
Date
Name
Owned For
Owner Type
Purchase Details
Closed on
Feb 28, 2005
Sold by
Forrest Eric W and Forrest Allison K
Bought by
Shaw Brian R and Ruddy Denise A
Current Estimated Value
Home Financials for this Owner
Home Financials are based on the most recent Mortgage that was taken out on this home.
Original Mortgage
$184,000
Outstanding Balance
$94,024
Interest Rate
5.73%
Estimated Equity
$250,142
Purchase Details
Closed on
Dec 22, 1997
Sold by
Ruoff Edwin M
Bought by
Forrest Eric W and Clark Allison K
Purchase Details
Closed on
Mar 20, 1990
Sold by
Carriage Park Assoc
Bought by
Mcfarlane Audrey C
Create a Home Valuation Report for This Property
The Home Valuation Report is an in-depth analysis detailing your home's value as well as a comparison with similar homes in the area
Home Values in the Area
Average Home Value in this Area
Purchase History
| Date | Buyer | Sale Price | Title Company |
|---|---|---|---|
| Shaw Brian R | $230,000 | -- | |
| Forrest Eric W | $65,250 | -- | |
| Clark Allison K | $65,250 | -- | |
| Mcfarlane Audrey C | $126,000 | -- |
Source: Public Records
Mortgage History
| Date | Status | Borrower | Loan Amount |
|---|---|---|---|
| Open | Mcfarlane Audrey C | $184,000 | |
| Closed | Mcfarlane Audrey C | $11,000 | |
| Previous Owner | Mcfarlane Audrey C | $15,000 |
Source: Public Records
Tax History Compared to Growth
Tax History
| Year | Tax Paid | Tax Assessment Tax Assessment Total Assessment is a certain percentage of the fair market value that is determined by local assessors to be the total taxable value of land and additions on the property. | Land | Improvement |
|---|---|---|---|---|
| 2025 | $6,942 | $151,240 | $43,180 | $108,060 |
| 2024 | $6,655 | $151,240 | $43,180 | $108,060 |
| 2023 | $6,421 | $150,940 | $43,180 | $107,760 |
| 2022 | $6,189 | $150,940 | $43,180 | $107,760 |
| 2021 | $5,823 | $117,990 | $32,710 | $85,280 |
| 2020 | $5,890 | $117,990 | $32,710 | $85,280 |
| 2019 | $5,794 | $117,990 | $32,710 | $85,280 |
| 2018 | $5,623 | $117,990 | $32,710 | $85,280 |
| 2017 | $5,551 | $117,990 | $32,710 | $85,280 |
| 2016 | $5,408 | $117,920 | $32,710 | $85,210 |
| 2015 | $5,408 | $117,920 | $32,710 | $85,210 |
| 2014 | $5,354 | $117,920 | $32,710 | $85,210 |
Source: Public Records
Map
Nearby Homes