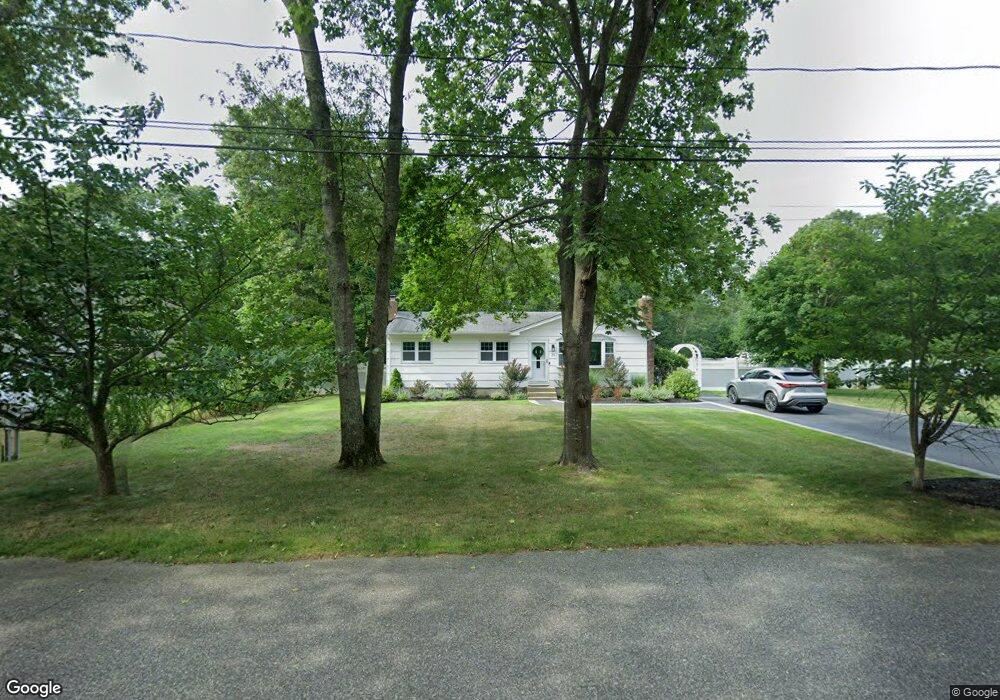
31 Howell Place Remsenburg-Speonk, NY 11972
Remsenburg-Speonk NeighborhoodEstimated Value: $517,000 - $638,050
3
Beds
1
Bath
943
Sq Ft
$615/Sq Ft
Est. Value
About This Home
This home is located at 31 Howell Place, Remsenburg-Speonk, NY 11972 and is currently estimated at $580,263, approximately $615 per square foot. 31 Howell Place is a home located in Suffolk County with nearby schools including Eastport-South Manor Junior/Senior High School and Raynor Country Day School.
Ownership History
Date
Name
Owned For
Owner Type
Purchase Details
Closed on
Jul 21, 2021
Sold by
Schmidt David J and Schmidt Candice
Bought by
Tarantowicz Peter W and Tierney Melissa
Current Estimated Value
Home Financials for this Owner
Home Financials are based on the most recent Mortgage that was taken out on this home.
Original Mortgage
$444,600
Outstanding Balance
$402,158
Interest Rate
2.7%
Mortgage Type
Purchase Money Mortgage
Estimated Equity
$178,105
Purchase Details
Closed on
Jul 28, 2014
Sold by
Pugh William and Pugh Linda
Bought by
Schmidt David J and Schmidt Candice
Home Financials for this Owner
Home Financials are based on the most recent Mortgage that was taken out on this home.
Original Mortgage
$209,600
Interest Rate
4.14%
Mortgage Type
New Conventional
Create a Home Valuation Report for This Property
The Home Valuation Report is an in-depth analysis detailing your home's value as well as a comparison with similar homes in the area
Home Values in the Area
Average Home Value in this Area
Purchase History
| Date | Buyer | Sale Price | Title Company |
|---|---|---|---|
| Tarantowicz Peter W | $494,000 | None Available | |
| Schmidt David J | $262,000 | Advantage Title Agency |
Source: Public Records
Mortgage History
| Date | Status | Borrower | Loan Amount |
|---|---|---|---|
| Open | Tarantowicz Peter W | $444,600 | |
| Previous Owner | Schmidt David J | $209,600 |
Source: Public Records
Tax History Compared to Growth
Tax History
| Year | Tax Paid | Tax Assessment Tax Assessment Total Assessment is a certain percentage of the fair market value that is determined by local assessors to be the total taxable value of land and additions on the property. | Land | Improvement |
|---|---|---|---|---|
| 2024 | $7,957 | $304,500 | $151,500 | $153,000 |
| 2023 | $7,957 | $304,500 | $151,500 | $153,000 |
| 2022 | $6,993 | $304,500 | $151,500 | $153,000 |
| 2021 | $6,993 | $294,200 | $151,500 | $142,700 |
| 2020 | $5,642 | $294,200 | $151,500 | $142,700 |
| 2019 | $5,642 | $0 | $0 | $0 |
| 2018 | -- | $261,100 | $133,200 | $127,900 |
| 2017 | $5,847 | $262,900 | $160,600 | $102,300 |
| 2016 | $5,806 | $262,900 | $160,600 | $102,300 |
| 2015 | -- | $247,600 | $142,800 | $104,800 |
| 2014 | -- | $247,600 | $142,800 | $104,800 |
Source: Public Records
Map
Nearby Homes
- 22 Drew Dr
- 22 Howell Place
- 183 Old Country Rd
- 202-214 Old Country Rd
- 91 Drew Dr
- 90 N Phillips Ave
- 3 Leslie Ct
- VL N Bay Ave
- 38 N Bay Ave
- 32 N Bay Ave
- 1538 Speonk Riverhead Rd Unit Lot 12
- 1538 Speonk Riverhead Rd Unit 6
- 3 Clay Pit Rd
- 247 Old Country Rd
- 366 Montauk Hwy
- VL Park Ave
- 190 S Country Rd
- 6 S Bay Ave
- 50a S Phillips Ave
- 16 Nidzyn Ave