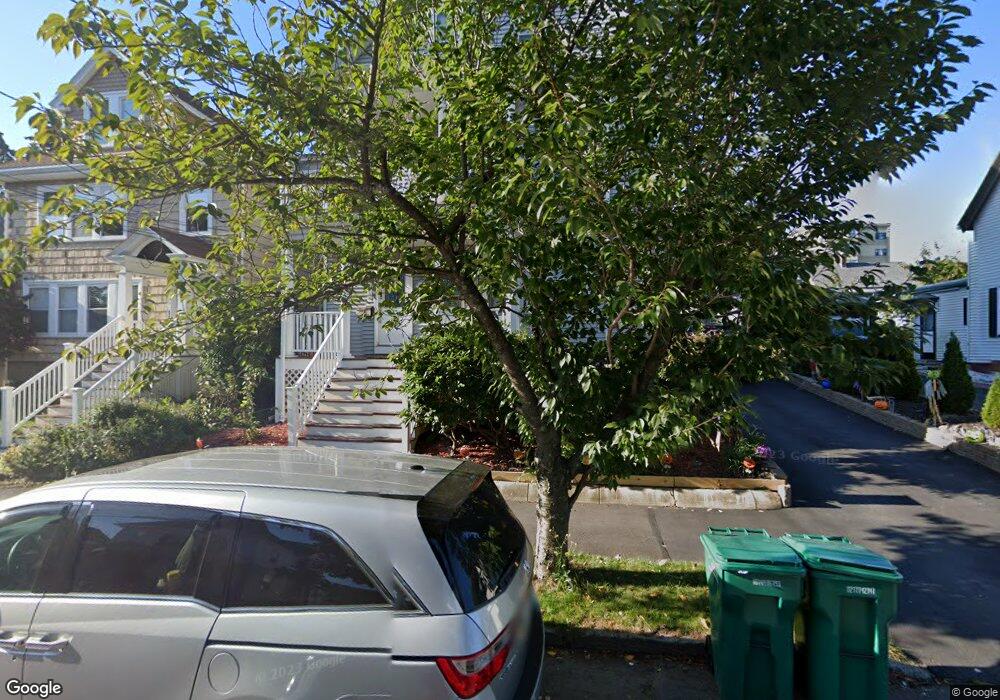
31 Huron St Unit 33 Lynn, MA 01902
Diamond District NeighborhoodEstimated Value: $819,000 - $959,000
4
Beds
2
Baths
2,832
Sq Ft
$309/Sq Ft
Est. Value
About This Home
This home is located at 31 Huron St Unit 33, Lynn, MA 01902 and is currently estimated at $873,971, approximately $308 per square foot. 31 Huron St Unit 33 is a home located in Essex County with nearby schools including Brickett Elementary School, William R. Fallon School, and Marshall Middle School.
Ownership History
Date
Name
Owned For
Owner Type
Purchase Details
Closed on
Mar 3, 2008
Sold by
Jones Carol A and Belcher Paula M
Bought by
Belcher Paula M
Current Estimated Value
Purchase Details
Closed on
Dec 29, 2000
Sold by
Jordan James M and Jordan Tina D
Bought by
Belcher Paula M and Jones Carol A
Purchase Details
Closed on
Mar 20, 1989
Sold by
Ogan Robert
Bought by
Jordan James M
Create a Home Valuation Report for This Property
The Home Valuation Report is an in-depth analysis detailing your home's value as well as a comparison with similar homes in the area
Home Values in the Area
Average Home Value in this Area
Purchase History
| Date | Buyer | Sale Price | Title Company |
|---|---|---|---|
| Belcher Paula M | -- | -- | |
| Belcher Paula M | -- | -- | |
| Belcher Paula M | $280,000 | -- | |
| Belcher Paula M | $280,000 | -- | |
| Jordan James M | $170,000 | -- | |
| Jordan James M | $170,000 | -- |
Source: Public Records
Mortgage History
| Date | Status | Borrower | Loan Amount |
|---|---|---|---|
| Open | Jordan James M | $50,000 | |
| Previous Owner | Jordan James M | $80,000 |
Source: Public Records
Tax History
| Year | Tax Paid | Tax Assessment Tax Assessment Total Assessment is a certain percentage of the fair market value that is determined by local assessors to be the total taxable value of land and additions on the property. | Land | Improvement |
|---|---|---|---|---|
| 2025 | $8,886 | $857,737 | $205,200 | $652,537 |
| 2024 | $8,406 | $798,300 | $192,900 | $605,400 |
| 2023 | $8,413 | $754,500 | $190,300 | $564,200 |
| 2022 | $8,431 | $678,300 | $153,100 | $525,200 |
| 2021 | $7,809 | $599,300 | $129,500 | $469,800 |
| 2020 | $7,240 | $540,300 | $126,400 | $413,900 |
| 2019 | $7,017 | $490,700 | $118,100 | $372,600 |
| 2018 | $6,714 | $443,200 | $127,300 | $315,900 |
| 2017 | $6,267 | $401,700 | $105,000 | $296,700 |
| 2016 | $5,957 | $368,200 | $105,400 | $262,800 |
| 2015 | $5,685 | $339,400 | $105,400 | $234,000 |
Source: Public Records
Map
Nearby Homes
- 97 Seymour Ave
- 11 Boynton St Unit 104
- 11 Boynton St Unit 101
- 11 Boynton St Unit 103
- 11 Boynton St Unit 201
- 32 Kings Beach Terrace
- 146 Burrill St
- 100 Burrill St Unit 6
- 143 Burrill St Unit 301
- 28 Claremont Terrace Unit 6
- 11 Seymour Ave Unit 3
- 7 Sidney Ave
- 4 Valley Rd Unit 4
- 106 Williams Ave
- 10-16 Stephen St Unit 5
- 80 Norfolk Ave Unit 1
- 129 Williams Ave
- 106 Norfolk Ave
- 162 Chatham St
- 168 Humphrey St Unit PH
Your Personal Tour Guide
Ask me questions while you tour the home.