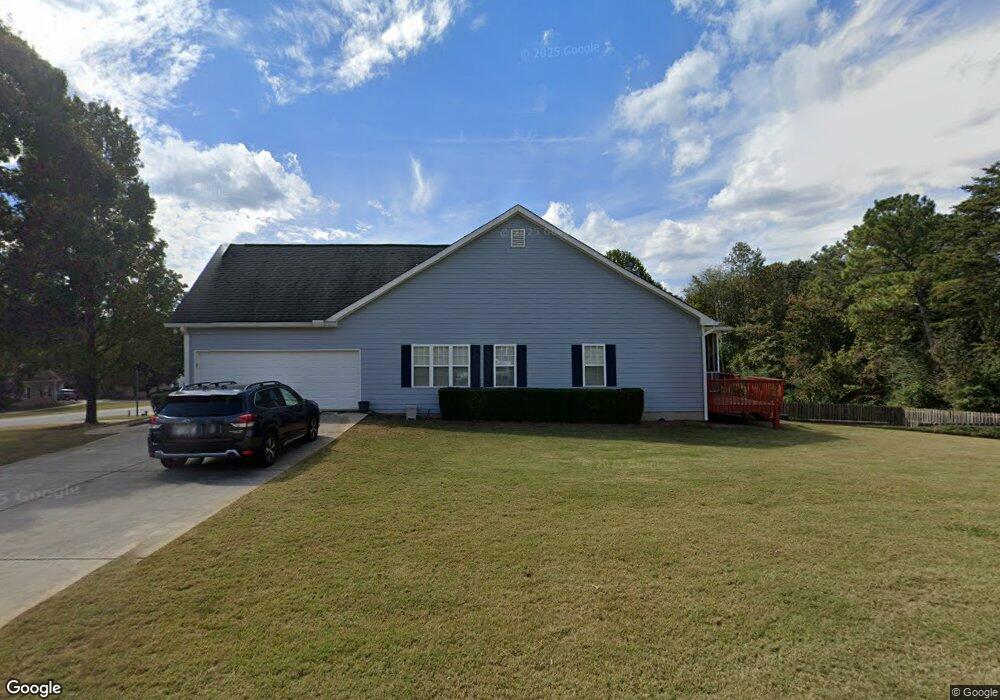
31 Iron Horse Cir Pendergrass, GA 30567
Estimated Value: $397,000 - $476,000
--
Bed
2
Baths
1,989
Sq Ft
$221/Sq Ft
Est. Value
About This Home
This home is located at 31 Iron Horse Cir, Pendergrass, GA 30567 and is currently estimated at $439,913, approximately $221 per square foot. 31 Iron Horse Cir is a home located in Jackson County with nearby schools including West Jackson Elementary School, West Jackson Middle School, and Jackson County High School.
Ownership History
Date
Name
Owned For
Owner Type
Purchase Details
Closed on
Mar 27, 2006
Sold by
Not Provided
Bought by
Newham Michael and Newham Katherine
Current Estimated Value
Home Financials for this Owner
Home Financials are based on the most recent Mortgage that was taken out on this home.
Original Mortgage
$231,200
Outstanding Balance
$133,246
Interest Rate
6.41%
Mortgage Type
New Conventional
Estimated Equity
$306,667
Purchase Details
Closed on
Jul 26, 2004
Sold by
Adkins Chester L and Adkins Sandra K
Bought by
Thompson Heather L and Thompson Charles E
Purchase Details
Closed on
Oct 13, 2003
Sold by
Tim Butler Homes Inc
Bought by
Adkins Chester L and Adkins Sandra K
Purchase Details
Closed on
Feb 17, 2003
Sold by
Butler Wendell
Bought by
Tim Butler Homes Inc
Create a Home Valuation Report for This Property
The Home Valuation Report is an in-depth analysis detailing your home's value as well as a comparison with similar homes in the area
Home Values in the Area
Average Home Value in this Area
Purchase History
| Date | Buyer | Sale Price | Title Company |
|---|---|---|---|
| Newham Michael | $289,000 | -- | |
| Thompson Heather L | $244,000 | -- | |
| Adkins Chester L | $233,000 | -- | |
| Tim Butler Homes Inc | $38,000 | -- |
Source: Public Records
Mortgage History
| Date | Status | Borrower | Loan Amount |
|---|---|---|---|
| Open | Newham Michael | $231,200 | |
| Closed | Newham Michael | $57,800 |
Source: Public Records
Tax History Compared to Growth
Tax History
| Year | Tax Paid | Tax Assessment Tax Assessment Total Assessment is a certain percentage of the fair market value that is determined by local assessors to be the total taxable value of land and additions on the property. | Land | Improvement |
|---|---|---|---|---|
| 2024 | $4,299 | $175,640 | $26,400 | $149,240 |
| 2023 | $4,299 | $159,880 | $26,400 | $133,480 |
| 2022 | $3,702 | $132,200 | $18,480 | $113,720 |
| 2021 | $3,728 | $132,200 | $18,480 | $113,720 |
| 2020 | $3,530 | $114,040 | $18,480 | $95,560 |
| 2019 | $3,583 | $114,040 | $18,480 | $95,560 |
| 2018 | $3,485 | $109,320 | $18,480 | $90,840 |
| 2017 | $3,263 | $101,372 | $18,500 | $82,872 |
| 2016 | $2,920 | $90,125 | $11,200 | $78,925 |
| 2015 | $2,933 | $90,125 | $11,200 | $78,925 |
| 2014 | $2,465 | $75,083 | $11,200 | $63,883 |
| 2013 | -- | $75,082 | $11,200 | $63,882 |
Source: Public Records
Map
Nearby Homes
- 0 Kinney Creek Ln Unit 10609320
- 67 Crab Orchard Way
- 61 Crab Orchard Way
- 100 Gleneagles Way
- 626 Walnut Creek Pkwy
- 606 Walnut Creek Pkwy
- 584 Walnut Creek Pkwy
- 562 Walnut Creek Pkwy
- 622 Pocket Rd
- 532 Walnut Creek Pkwy
- 502 Walnut Creek Pkwy
- 4515 Highway 60
- 0 Guy Cooper Rd Unit 10545221
- 749 Hubert Pittman Tract 2 Rd
- 749 Hubert Pittman Rd Unit TRACT 2
- 749 Hubert Pittman Rd Unit TRACT 2 AND 3
- 749 Hubert Pittman Rd
- 749 Hubert Pittman Rd Unit TRACT 3
- 749 Hubert Pittman Tract 3 Rd
- 1745 Liberty Park Dr
- 268 Station Dr
- 57 Iron Horse Cir
- 202 Station Dr
- 0 Station Dr Unit 7377530
- 0 Station Dr Unit 7019856
- 0 Station Dr Unit 8758464
- 0 Station Dr Unit 8594938
- 0 Station Dr Unit 8342831
- 0 Station Dr Unit 8232646
- 0 Station Dr Unit 7638417
- 0 Station Dr Unit 7604693
- 231 Station Dr
- 265 Station Dr
- 209 Station Dr
- 70 Iron Horse Cir
- 294 Station Dr
- 85 Iron Horse Cir
- 183 Station Dr
- 287 Station Dr
- 104 Iron Horse Cir