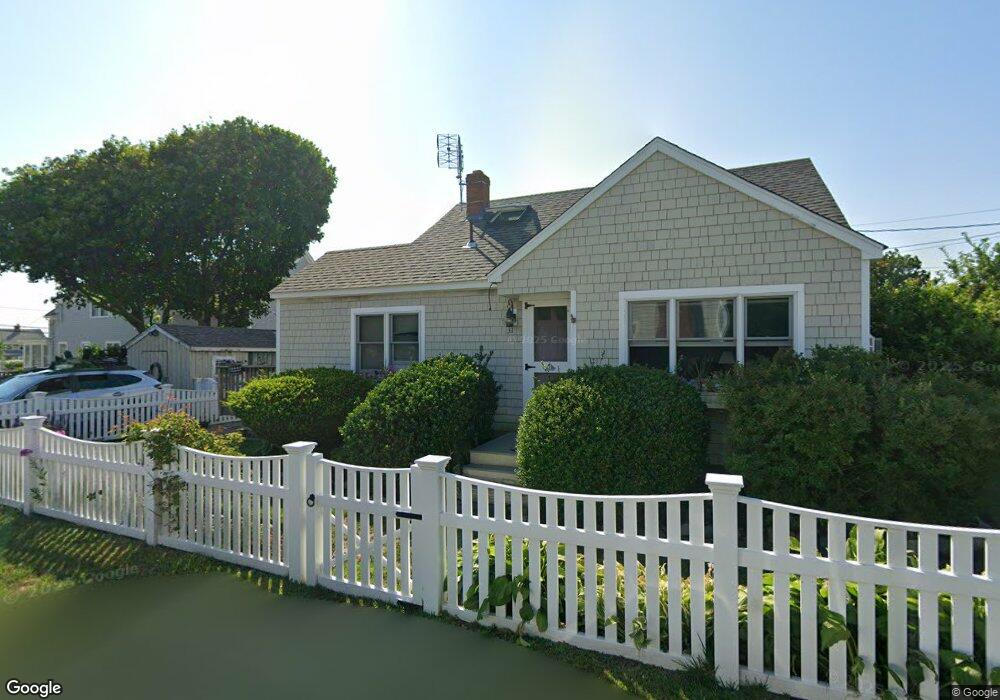
31 John Alden St Marshfield, MA 02050
Ocean Bluff-Brant Rock NeighborhoodEstimated Value: $641,000 - $733,784
3
Beds
1
Bath
1,006
Sq Ft
$679/Sq Ft
Est. Value
About This Home
This home is located at 31 John Alden St, Marshfield, MA 02050 and is currently estimated at $682,946, approximately $678 per square foot. 31 John Alden St is a home with nearby schools including Governor Edward Winslow School, Furnace Brook Middle School, and Marshfield High School.
Ownership History
Date
Name
Owned For
Owner Type
Purchase Details
Closed on
Nov 21, 1997
Sold by
Hennessy John T and Hennessy Gretchen A
Bought by
Mallon Edward J and Mcnamara Suzanne F
Current Estimated Value
Purchase Details
Closed on
Aug 11, 1992
Sold by
Cushman Janis S
Bought by
Hennessy John T and Hennessy Gretchen A
Create a Home Valuation Report for This Property
The Home Valuation Report is an in-depth analysis detailing your home's value as well as a comparison with similar homes in the area
Home Values in the Area
Average Home Value in this Area
Purchase History
| Date | Buyer | Sale Price | Title Company |
|---|---|---|---|
| Mallon Edward J | $135,000 | -- | |
| Mallon Edward J | $135,000 | -- | |
| Hennessy John T | $87,500 | -- |
Source: Public Records
Mortgage History
| Date | Status | Borrower | Loan Amount |
|---|---|---|---|
| Open | Hennessy John T | $186,600 | |
| Closed | Hennessy John T | $117,497 |
Source: Public Records
Tax History
| Year | Tax Paid | Tax Assessment Tax Assessment Total Assessment is a certain percentage of the fair market value that is determined by local assessors to be the total taxable value of land and additions on the property. | Land | Improvement |
|---|---|---|---|---|
| 2025 | $7,010 | $708,100 | $500,300 | $207,800 |
| 2024 | $6,608 | $636,000 | $446,700 | $189,300 |
| 2023 | $6,553 | $568,700 | $405,000 | $163,700 |
| 2022 | $6,553 | $506,000 | $367,300 | $138,700 |
| 2021 | $6,483 | $491,500 | $367,300 | $124,200 |
| 2020 | $5,943 | $445,800 | $321,600 | $124,200 |
| 2019 | $5,859 | $437,900 | $321,600 | $116,300 |
| 2018 | $5,196 | $388,600 | $277,900 | $110,700 |
| 2017 | $5,160 | $376,100 | $277,900 | $98,200 |
| 2016 | $4,812 | $346,700 | $264,000 | $82,700 |
| 2015 | $4,608 | $346,700 | $264,000 | $82,700 |
| 2014 | $4,537 | $341,400 | $264,000 | $77,400 |
Source: Public Records
Map
Nearby Homes
- 34 Puritan St
- 92 Plymouth Ave
- 31 Puritan St
- 79 Ashburton Ave
- 81 Plymouth Ave
- 83 Ashburton Ave
- 89 Ashburton Ave
- 89 Plymouth Ave
- 89 Plymouth Ave Unit 1
- 25 Puritan St
- 46 Webster Ave
- 45 Colonial Rd
- 95 Ashburton Ave
- 83 Plymouth Ave
- 70 Plymouth Ave
- 75 Ashburton Ave
- 32 Colonial Rd
- 69 Ashburton Ave
- 52 Puritan St
- 99 Plymouth Ave
Your Personal Tour Guide
Ask me questions while you tour the home.