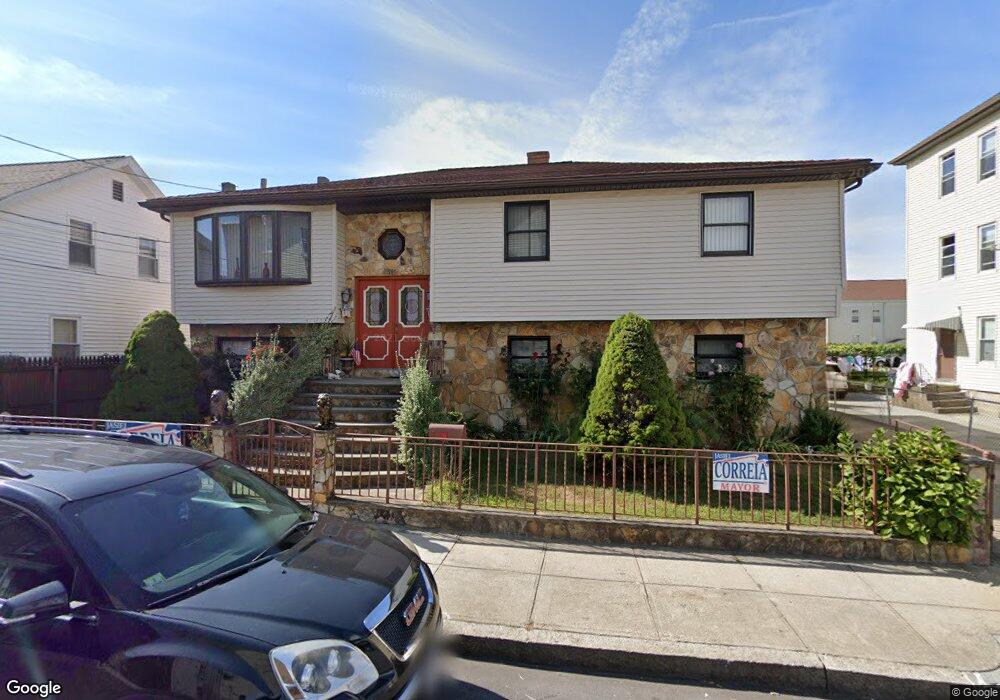
31 John St Fall River, MA 02721
Corky Row NeighborhoodEstimated Value: $464,000 - $581,000
6
Beds
2
Baths
1,472
Sq Ft
$348/Sq Ft
Est. Value
About This Home
This home is located at 31 John St, Fall River, MA 02721 and is currently estimated at $512,753, approximately $348 per square foot. 31 John St is a home located in Bristol County with nearby schools including Henry Lord Community School, B M C Durfee High School, and Argosy Collegiate Charter School.
Ownership History
Date
Name
Owned For
Owner Type
Purchase Details
Closed on
Apr 19, 2022
Sold by
Jaya Judite
Bought by
Jaya Judite and Jaya Jose A
Current Estimated Value
Purchase Details
Closed on
Feb 10, 2017
Sold by
Pimentel Duarte and Pimentel Judite
Bought by
Pimentel Judite
Home Financials for this Owner
Home Financials are based on the most recent Mortgage that was taken out on this home.
Original Mortgage
$152,000
Interest Rate
4.32%
Mortgage Type
New Conventional
Purchase Details
Closed on
Jun 30, 2004
Sold by
Viveiros Alvaro C and Viveiros Maria Gloria
Bought by
Pimentel Duarte and Pimentel Judite
Home Financials for this Owner
Home Financials are based on the most recent Mortgage that was taken out on this home.
Original Mortgage
$155,000
Interest Rate
6.3%
Mortgage Type
Purchase Money Mortgage
Create a Home Valuation Report for This Property
The Home Valuation Report is an in-depth analysis detailing your home's value as well as a comparison with similar homes in the area
Home Values in the Area
Average Home Value in this Area
Purchase History
| Date | Buyer | Sale Price | Title Company |
|---|---|---|---|
| Jaya Judite | -- | None Available | |
| Pimentel Judite | -- | -- | |
| Pimentel Duarte | $280,000 | -- |
Source: Public Records
Mortgage History
| Date | Status | Borrower | Loan Amount |
|---|---|---|---|
| Previous Owner | Pimentel Judite | $152,000 | |
| Previous Owner | Pimentel Duarte | $155,000 | |
| Previous Owner | Pimentel Duarte | $9,000 | |
| Previous Owner | Pimentel Duarte | $12,500 |
Source: Public Records
Tax History
| Year | Tax Paid | Tax Assessment Tax Assessment Total Assessment is a certain percentage of the fair market value that is determined by local assessors to be the total taxable value of land and additions on the property. | Land | Improvement |
|---|---|---|---|---|
| 2025 | $4,267 | $372,700 | $103,500 | $269,200 |
| 2024 | $3,779 | $328,900 | $96,700 | $232,200 |
| 2023 | $3,801 | $309,800 | $81,100 | $228,700 |
| 2022 | $3,349 | $265,400 | $77,200 | $188,200 |
| 2021 | $3,379 | $244,300 | $73,900 | $170,400 |
| 2020 | $3,303 | $228,600 | $71,500 | $157,100 |
| 2019 | $3,505 | $240,400 | $71,500 | $168,900 |
| 2018 | $3,440 | $235,300 | $74,900 | $160,400 |
| 2017 | $3,276 | $234,000 | $74,900 | $159,100 |
| 2016 | $3,035 | $222,700 | $70,700 | $152,000 |
| 2015 | $3,292 | $251,700 | $81,700 | $170,000 |
| 2014 | $3,136 | $249,300 | $79,300 | $170,000 |
Source: Public Records
Map
Nearby Homes
- 26 -30 Brow
- 17 John St
- 10 &14 John St
- 132 5th St Unit 5
- 132 5th St Unit 4
- 132 5th St
- 132 5th St Unit 3
- 132 5th St Unit 2
- 132 5th St Unit 1
- 23, 26, 30 Brow St
- 15 Brow St
- 9 John St
- 18 John St
- 18 John St Unit 18 John St 3rd floor
- 24 John St
- 126 5th St
- 23 Brow St Unit 1W
- 23 Brow St Unit 2E
- 23 Brow St Unit 2W
- 23 Brow St Unit 1E
Your Personal Tour Guide
Ask me questions while you tour the home.