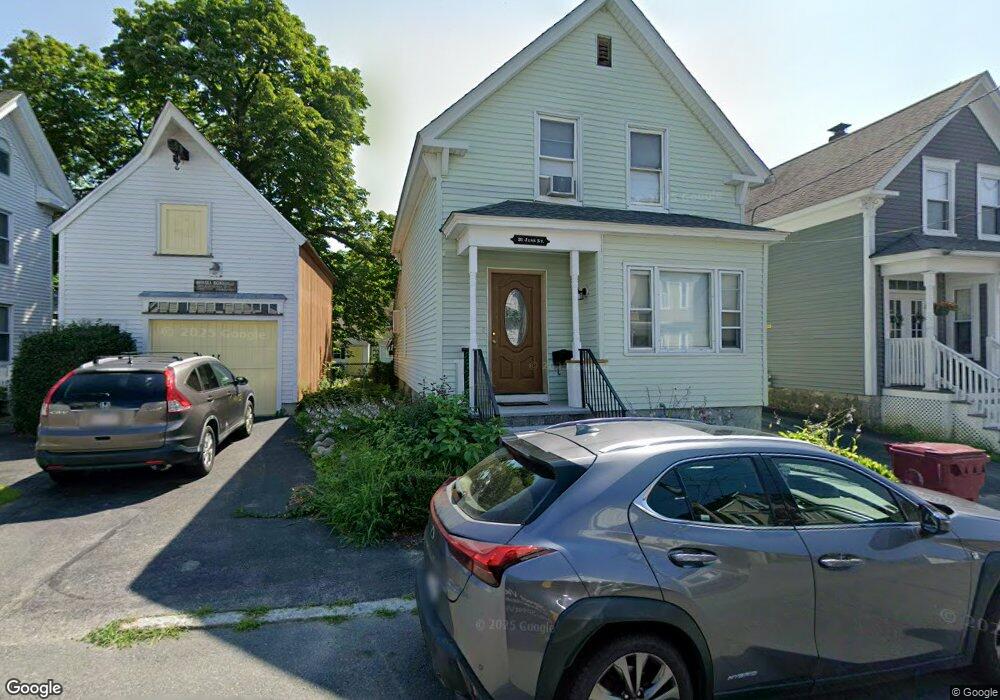
31 June St Lowell, MA 01850
Centralville NeighborhoodEstimated Value: $384,000 - $394,000
3
Beds
1
Bath
1,149
Sq Ft
$339/Sq Ft
Est. Value
About This Home
This home is located at 31 June St, Lowell, MA 01850 and is currently estimated at $389,666, approximately $339 per square foot. 31 June St is a home located in Middlesex County with nearby schools including S. Christa McAuliffe Elementary School, Greenhalge Elementary School, and Moody Elementary School.
Ownership History
Date
Name
Owned For
Owner Type
Purchase Details
Closed on
Jan 4, 2011
Sold by
Callahan Rebekah J
Bought by
Michaels Alexander S and Michaels Cynthia M
Current Estimated Value
Purchase Details
Closed on
Mar 17, 1997
Sold by
Cormier Donald L
Bought by
Stasiowski Barak J and Callahan Rebehak H
Purchase Details
Closed on
Feb 18, 1987
Sold by
Jussaume Gerald R
Bought by
Cormier Donald L
Create a Home Valuation Report for This Property
The Home Valuation Report is an in-depth analysis detailing your home's value as well as a comparison with similar homes in the area
Home Values in the Area
Average Home Value in this Area
Purchase History
| Date | Buyer | Sale Price | Title Company |
|---|---|---|---|
| Michaels Alexander S | $55,900 | -- | |
| Michaels Alexander S | $55,900 | -- | |
| Stasiowski Barak J | $89,000 | -- | |
| Stasiowski Barak J | $89,000 | -- | |
| Cormier Donald L | $119,000 | -- |
Source: Public Records
Mortgage History
| Date | Status | Borrower | Loan Amount |
|---|---|---|---|
| Previous Owner | Cormier Donald L | $117,600 | |
| Previous Owner | Cormier Donald L | $87,642 |
Source: Public Records
Tax History Compared to Growth
Tax History
| Year | Tax Paid | Tax Assessment Tax Assessment Total Assessment is a certain percentage of the fair market value that is determined by local assessors to be the total taxable value of land and additions on the property. | Land | Improvement |
|---|---|---|---|---|
| 2025 | $3,907 | $340,300 | $118,800 | $221,500 |
| 2024 | $3,809 | $319,800 | $111,000 | $208,800 |
| 2023 | $3,584 | $288,600 | $96,500 | $192,100 |
| 2022 | $3,260 | $256,900 | $87,800 | $169,100 |
| 2021 | $3,038 | $225,700 | $76,300 | $149,400 |
| 2020 | $2,786 | $208,500 | $66,700 | $141,800 |
| 2019 | $2,537 | $180,700 | $61,700 | $119,000 |
| 2018 | $2,425 | $171,300 | $58,800 | $112,500 |
| 2017 | $2,395 | $160,500 | $53,400 | $107,100 |
| 2016 | $2,274 | $150,000 | $52,100 | $97,900 |
| 2015 | $2,209 | $142,700 | $52,100 | $90,600 |
| 2013 | $2,134 | $142,200 | $60,900 | $81,300 |
Source: Public Records
Map
Nearby Homes