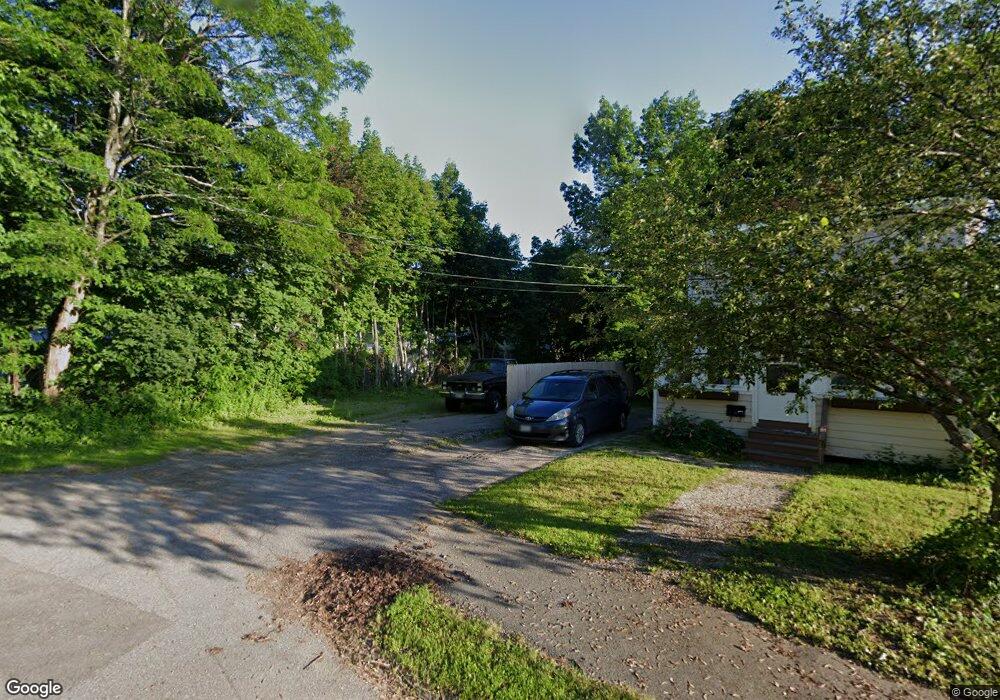
31 Kineo St Bangor, ME 04401
West Bangor NeighborhoodEstimated Value: $85,000 - $392,000
3
Beds
1
Bath
1,724
Sq Ft
$151/Sq Ft
Est. Value
About This Home
This home is located at 31 Kineo St, Bangor, ME 04401 and is currently estimated at $259,667, approximately $150 per square foot. 31 Kineo St is a home located in Penobscot County with nearby schools including Fourteenth Street School, Fairmount School, and James F. Doughty School.
Ownership History
Date
Name
Owned For
Owner Type
Purchase Details
Closed on
Sep 5, 2019
Sold by
Fnma
Bought by
Nac Properties Llc
Current Estimated Value
Purchase Details
Closed on
May 4, 2007
Sold by
Sargent Thomas E and Sargent Linda
Bought by
Sargent Linda
Home Financials for this Owner
Home Financials are based on the most recent Mortgage that was taken out on this home.
Original Mortgage
$100,000
Interest Rate
6.23%
Mortgage Type
Unknown
Create a Home Valuation Report for This Property
The Home Valuation Report is an in-depth analysis detailing your home's value as well as a comparison with similar homes in the area
Home Values in the Area
Average Home Value in this Area
Purchase History
| Date | Buyer | Sale Price | Title Company |
|---|---|---|---|
| Nac Properties Llc | -- | -- | |
| Sargent Linda | -- | -- |
Source: Public Records
Mortgage History
| Date | Status | Borrower | Loan Amount |
|---|---|---|---|
| Previous Owner | Sargent Linda | $25,000 | |
| Previous Owner | Sargent Linda | $100,000 |
Source: Public Records
Tax History Compared to Growth
Tax History
| Year | Tax Paid | Tax Assessment Tax Assessment Total Assessment is a certain percentage of the fair market value that is determined by local assessors to be the total taxable value of land and additions on the property. | Land | Improvement |
|---|---|---|---|---|
| 2024 | $171 | $9,200 | $9,200 | $0 |
| 2023 | $176 | $9,200 | $9,200 | $0 |
| 2022 | $188 | $9,200 | $9,200 | $0 |
| 2021 | $192 | $8,600 | $8,600 | $0 |
| 2020 | $749 | $32,300 | $10,500 | $21,800 |
| 2019 | $725 | $31,500 | $10,500 | $21,000 |
| 2018 | $723 | $31,500 | $10,500 | $21,000 |
| 2017 | $2,057 | $100,000 | $10,500 | $89,500 |
| 2016 | $2,196 | $97,600 | $10,500 | $87,100 |
| 2015 | $2,175 | $99,100 | $10,500 | $88,600 |
| 2014 | $2,143 | $98,300 | $10,500 | $87,800 |
| 2013 | $2,045 | $98,300 | $10,500 | $87,800 |
Source: Public Records
Map
Nearby Homes