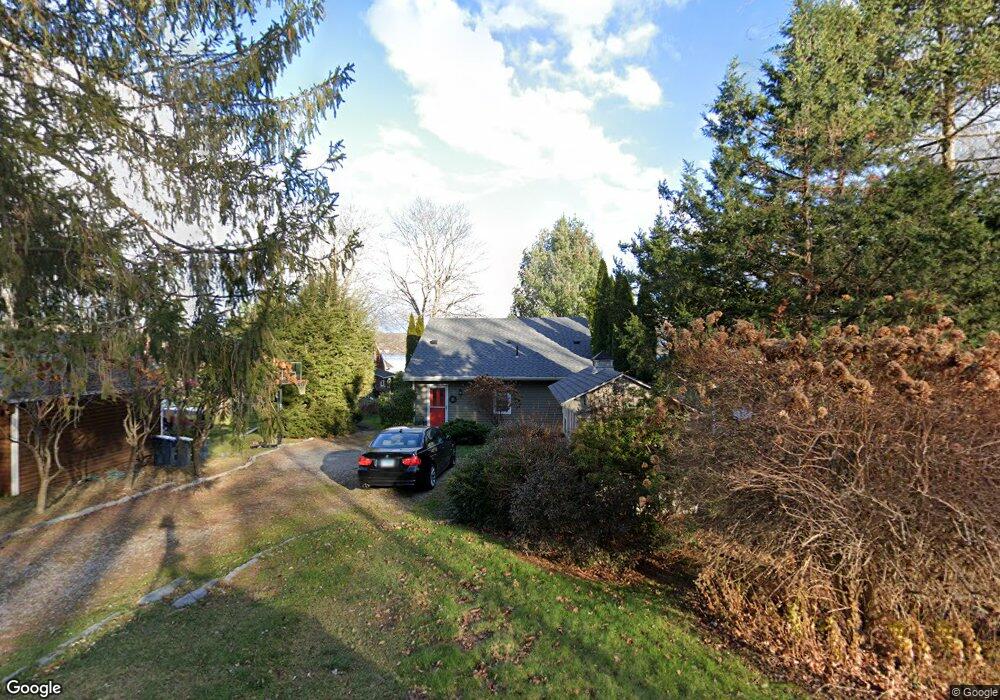
31 Lakeside Dr Andover, CT 06232
Estimated Value: $417,000 - $545,000
2
Beds
1
Bath
1,277
Sq Ft
$374/Sq Ft
Est. Value
About This Home
This home is located at 31 Lakeside Dr, Andover, CT 06232 and is currently estimated at $477,983, approximately $374 per square foot. 31 Lakeside Dr is a home located in Tolland County with nearby schools including Andover Elementary School, RHAM Middle School, and RHAM High School.
Ownership History
Date
Name
Owned For
Owner Type
Purchase Details
Closed on
May 5, 2020
Sold by
Carso Kyle T
Bought by
Carso Dorothy F
Current Estimated Value
Purchase Details
Closed on
May 27, 1997
Sold by
Cramer Anne
Bought by
Carso Kyle and Carso Dorothy
Create a Home Valuation Report for This Property
The Home Valuation Report is an in-depth analysis detailing your home's value as well as a comparison with similar homes in the area
Home Values in the Area
Average Home Value in this Area
Purchase History
| Date | Buyer | Sale Price | Title Company |
|---|---|---|---|
| Carso Dorothy F | -- | None Available | |
| Carso Dorothy F | -- | None Available | |
| Carso Kyle | $146,900 | -- | |
| Carso Kyle | $146,900 | -- |
Source: Public Records
Mortgage History
| Date | Status | Borrower | Loan Amount |
|---|---|---|---|
| Previous Owner | Carso Kyle | $105,605 | |
| Previous Owner | Carso Kyle | $173,600 | |
| Previous Owner | Carso Kyle | $147,000 |
Source: Public Records
Tax History Compared to Growth
Tax History
| Year | Tax Paid | Tax Assessment Tax Assessment Total Assessment is a certain percentage of the fair market value that is determined by local assessors to be the total taxable value of land and additions on the property. | Land | Improvement |
|---|---|---|---|---|
| 2025 | $8,173 | $258,720 | $161,210 | $97,510 |
| 2024 | $8,139 | $258,720 | $161,210 | $97,510 |
| 2023 | $8,095 | $258,720 | $161,210 | $97,510 |
| 2022 | $8,256 | $258,720 | $161,210 | $97,510 |
| 2021 | $6,880 | $191,100 | $113,400 | $77,700 |
| 2020 | $6,766 | $190,000 | $113,400 | $76,600 |
| 2019 | $6,648 | $190,000 | $113,400 | $76,600 |
| 2018 | $6,451 | $190,000 | $113,400 | $76,600 |
| 2017 | $6,175 | $190,000 | $113,400 | $76,600 |
| 2016 | $6,061 | $197,300 | $119,100 | $78,200 |
| 2015 | $6,061 | $197,300 | $119,100 | $78,200 |
| 2014 | $6,061 | $197,300 | $119,100 | $78,200 |
Source: Public Records
Map
Nearby Homes
- 239 Lake Rd
- 74 Erdoni Rd
- 43 Route 87
- 0 Us Highway 6
- 10 Lakeview Park
- 127 Route 87
- 00 Bunker Hill Rd
- 35 Basket Shop Rd
- 78 Bear Swamp Rd
- 44 Route 6
- 0 Wheeling Rd Unit 24116879
- 40 Wheeling Rd
- 78 Hennequin Rd
- 41 Oakwood Ln
- 127 U S 6
- 249 Wall St
- 559 East St
- 4 Timber Trail
- 150 London Rd
- 0 Wells Wood Rd Unit 24118855