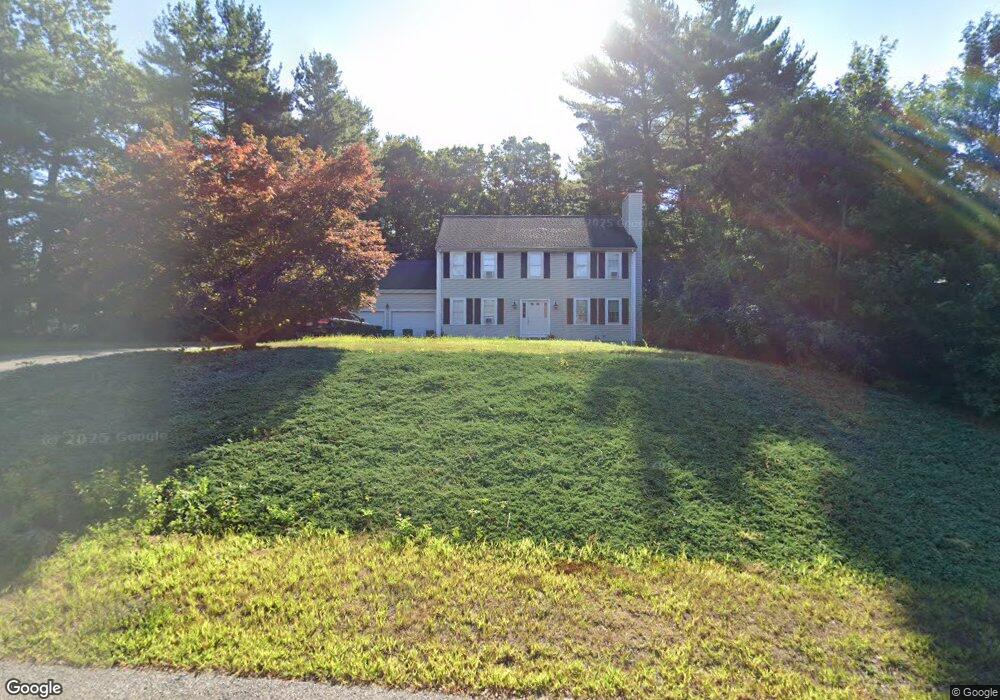
31 Lantern Ln Pembroke, MA 02359
Estimated Value: $803,761 - $932,000
4
Beds
3
Baths
2,140
Sq Ft
$407/Sq Ft
Est. Value
About This Home
This home is located at 31 Lantern Ln, Pembroke, MA 02359 and is currently estimated at $870,440, approximately $406 per square foot. 31 Lantern Ln is a home located in Plymouth County with nearby schools including Pembroke High School.
Ownership History
Date
Name
Owned For
Owner Type
Purchase Details
Closed on
Feb 4, 2025
Sold by
Merlin Carl A and Merlin Julie
Bought by
Merlin Julie
Current Estimated Value
Purchase Details
Closed on
Mar 1, 2010
Sold by
Krzywda Frank S and Krzywda Mary P
Bought by
Merlin Carl A and Merlin Julie
Purchase Details
Closed on
Jul 18, 2005
Sold by
Caruso Angelo and Caruso Julie M
Bought by
Krzywda Mary P and Krzywda Frank S
Purchase Details
Closed on
Apr 17, 2001
Sold by
Elko Constr Corp
Bought by
Caruso Angelo and Caruso Julie M
Create a Home Valuation Report for This Property
The Home Valuation Report is an in-depth analysis detailing your home's value as well as a comparison with similar homes in the area
Home Values in the Area
Average Home Value in this Area
Purchase History
| Date | Buyer | Sale Price | Title Company |
|---|---|---|---|
| Merlin Julie | -- | None Available | |
| Merlin Julie | -- | None Available | |
| Merlin Carl A | $420,000 | -- | |
| Merlin Carl A | $420,000 | -- | |
| Krzywda Mary P | $495,000 | -- | |
| Krzywda Mary P | $495,000 | -- | |
| Caruso Angelo | $145,000 | -- | |
| Caruso Angelo | $145,000 | -- |
Source: Public Records
Mortgage History
| Date | Status | Borrower | Loan Amount |
|---|---|---|---|
| Previous Owner | Caruso Angelo | $104,634 | |
| Previous Owner | Caruso Angelo | $120,000 |
Source: Public Records
Tax History Compared to Growth
Tax History
| Year | Tax Paid | Tax Assessment Tax Assessment Total Assessment is a certain percentage of the fair market value that is determined by local assessors to be the total taxable value of land and additions on the property. | Land | Improvement |
|---|---|---|---|---|
| 2025 | $8,653 | $719,900 | $325,900 | $394,000 |
| 2024 | $8,568 | $712,200 | $320,700 | $391,500 |
| 2023 | $8,078 | $635,100 | $295,900 | $339,200 |
| 2022 | $7,594 | $536,700 | $235,800 | $300,900 |
| 2021 | $7,601 | $521,300 | $230,600 | $290,700 |
| 2020 | $7,468 | $515,400 | $230,600 | $284,800 |
| 2019 | $6,888 | $471,800 | $220,500 | $251,300 |
| 2018 | $6,884 | $462,300 | $220,500 | $241,800 |
| 2017 | $6,726 | $445,400 | $205,700 | $239,700 |
| 2016 | $6,582 | $431,300 | $195,700 | $235,600 |
| 2015 | $6,539 | $443,600 | $185,700 | $257,900 |
Source: Public Records
Map
Nearby Homes