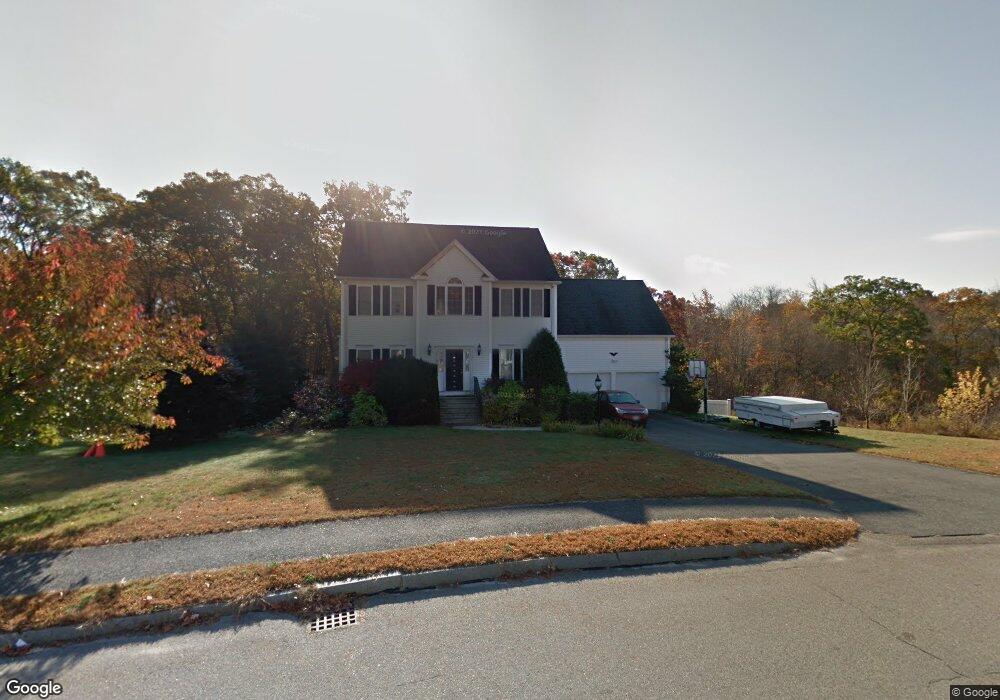
31 Larkin Ln Hopedale, MA 01747
Estimated Value: $737,602 - $884,000
3
Beds
3
Baths
2,481
Sq Ft
$324/Sq Ft
Est. Value
About This Home
This home is located at 31 Larkin Ln, Hopedale, MA 01747 and is currently estimated at $803,651, approximately $323 per square foot. 31 Larkin Ln is a home located in Worcester County with nearby schools including Memorial Elementary School, Hopedale Jr Sr High School, and Bethany Christian Academy.
Ownership History
Date
Name
Owned For
Owner Type
Purchase Details
Closed on
Mar 17, 2025
Sold by
Sousa Stephen M
Bought by
Sousa Anna W
Current Estimated Value
Purchase Details
Closed on
Feb 4, 2015
Sold by
Wolff Alan W and Wolff Helene N
Bought by
Sousa Anna W
Purchase Details
Closed on
Aug 7, 2003
Sold by
Sousa Anna W and Sousa Stephen M
Bought by
Wolff Alan William and Sousa Anna W
Home Financials for this Owner
Home Financials are based on the most recent Mortgage that was taken out on this home.
Original Mortgage
$308,000
Interest Rate
5.28%
Mortgage Type
Purchase Money Mortgage
Purchase Details
Closed on
Jun 21, 2001
Sold by
Greene Mill Prop
Bought by
Sousa Stephen M and Sousa Anna W
Home Financials for this Owner
Home Financials are based on the most recent Mortgage that was taken out on this home.
Original Mortgage
$275,000
Interest Rate
7.09%
Mortgage Type
Purchase Money Mortgage
Create a Home Valuation Report for This Property
The Home Valuation Report is an in-depth analysis detailing your home's value as well as a comparison with similar homes in the area
Home Values in the Area
Average Home Value in this Area
Purchase History
| Date | Buyer | Sale Price | Title Company |
|---|---|---|---|
| Sousa Anna W | -- | None Available | |
| Sousa Anna W | -- | None Available | |
| Sousa Anna W | -- | -- | |
| Sousa Anna W | -- | -- | |
| Wolff Alan William | -- | -- | |
| Wolff Alan William | -- | -- | |
| Wolff Alan William | -- | -- | |
| Sousa Stephen M | $352,150 | -- | |
| Sousa Stephen M | $352,150 | -- |
Source: Public Records
Mortgage History
| Date | Status | Borrower | Loan Amount |
|---|---|---|---|
| Previous Owner | Wolff Alan William | $308,000 | |
| Previous Owner | Sousa Stephen M | $275,000 |
Source: Public Records
Tax History Compared to Growth
Tax History
| Year | Tax Paid | Tax Assessment Tax Assessment Total Assessment is a certain percentage of the fair market value that is determined by local assessors to be the total taxable value of land and additions on the property. | Land | Improvement |
|---|---|---|---|---|
| 2025 | $11,579 | $697,100 | $219,000 | $478,100 |
| 2024 | $11,027 | $664,300 | $208,700 | $455,600 |
| 2023 | $9,869 | $611,100 | $205,300 | $405,800 |
| 2022 | $9,619 | $562,200 | $188,200 | $374,000 |
| 2021 | $9,194 | $514,500 | $171,100 | $343,400 |
| 2020 | $8,957 | $514,500 | $171,100 | $343,400 |
| 2019 | $8,411 | $478,700 | $171,100 | $307,600 |
| 2018 | $5,084 | $469,800 | $171,100 | $298,700 |
| 2017 | $7,813 | $451,900 | $171,100 | $280,800 |
| 2016 | $7,518 | $446,700 | $171,100 | $275,600 |
| 2015 | $7,153 | $431,400 | $171,100 | $260,300 |
Source: Public Records
Map
Nearby Homes
- 29 Harmony Trail
- 222 S Main St
- 211A S Main St
- The Brooklyn Plan at Harmony - Subdivision
- The Meadow Plan at Harmony - Subdivision
- The Layla Plan at Harmony - Subdivision
- The Ashley Plan at Harmony - Subdivision
- The Everleigh Plan at Harmony - Subdivision
- The Tucker Plan at Harmony - Subdivision
- The Iris Plan at Harmony - Subdivision
- 256 S Main St
- 267 S Main St
- 7 Howard St
- 11 Heron Ln
- 270 S Main St
- 6 Mellen St
- 164 Greene St
- 3 Birch Cir
- 3 Pouliot St Unit 3
- 23 Bens Way
- 33 Larkin Ln
- 32 Larkin Ln
- 34 Larkin Ln
- 29 Larkin Ln
- 30 Larkin Ln
- 35 Larkin Ln
- 3 Liberty Cir
- 5 Liberty Cir
- 37 Larkin Ln
- 4 Liberty Cir
- LT 39 Harmony Trails III
- 28 Larkin Ln
- 2 Liberty Cir
- 2 Liberty Cir Unit 1
- LT 38 Harmony Trail III
- 35 Harmony Trail
- LT 41 Harmony Trail III
- LT 44 Harmony Greens
- 6 Liberty Cir
- LT 45 Harmony Greens