
Landlord's Agent in 2025
JULIE CREMIN
William Raveis R.E. & Home Services
(781) 308-5186
1 in this area
51 Total Sales

Estimated Value: $1,602,117 - $1,780,000
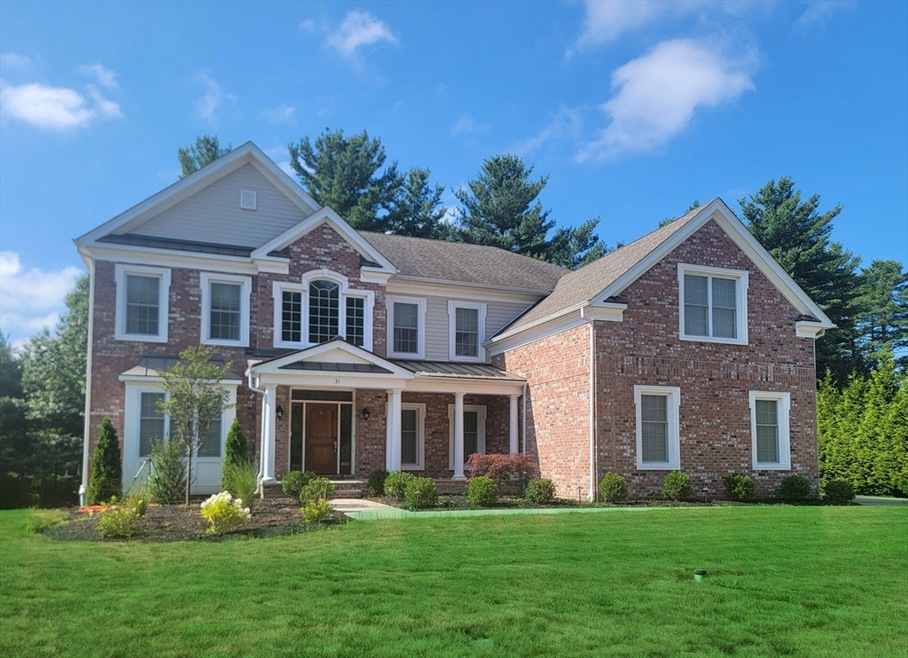
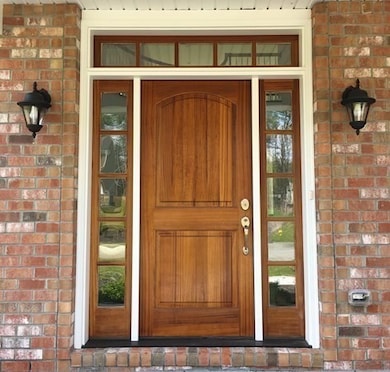
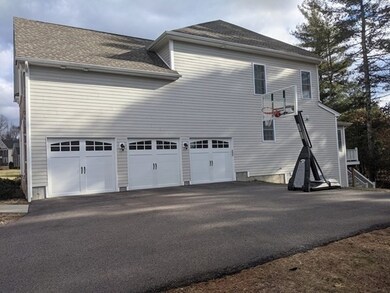
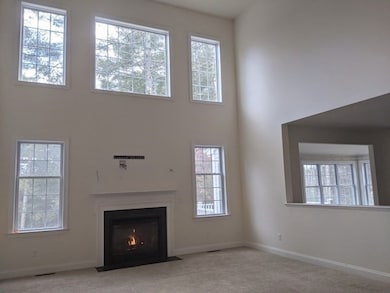
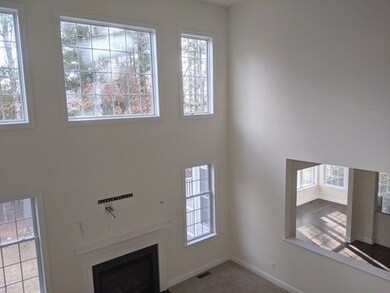
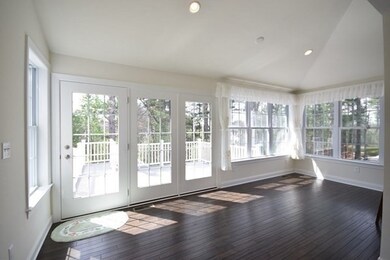
Beautiful 2016 custom built single family located in a prestigious subdivision. The house sets on over an acre of tranquil peaceful land. Very spacious with 4149 sqft and has a three car garage. This well designed home welcomes you with a brick front, architectural columns, mahogany door and a super-sized deck at the rear. Inside you will find an impressive two-story foyer, a two-story family room with a fireplace, high ceilings and a gorgeous sunroom. This house provides you with lots of space including a large master suite with spa like master bath, a sitting room and separate makeup desk, tons of storage, and a walk-out basement. Expansive gourmet kitchen with custom cabinets, granite counters and stainless steel appliances, and expanded breakfast area. Can be rented furnished for extra. Pets allowed with landlord's approval. Looking for tenants with good credits and references. Minimum 9 month lease. Prefer longer term. Available now. Move in and enjoy your beautiful house!
Last Agent to Rent the Property
William Raveis R.E. & Home Services Listed on: 10/09/2025
| Date | Event | Price | List to Sale | Price per Sq Ft | Prior Sale |
|---|---|---|---|---|---|
| 10/18/2025 10/18/25 | Rented | $6,475 | 0.0% | -- | |
| 10/14/2025 10/14/25 | Under Contract | -- | -- | -- | |
| 10/09/2025 10/09/25 | For Rent | $6,475 | -3.4% | -- | |
| 01/01/2024 01/01/24 | Rented | $6,700 | 0.0% | -- | |
| 12/11/2023 12/11/23 | Under Contract | -- | -- | -- | |
| 11/29/2023 11/29/23 | For Rent | $6,700 | +21.8% | -- | |
| 02/20/2021 02/20/21 | Rented | $5,500 | 0.0% | -- | |
| 02/17/2021 02/17/21 | Under Contract | -- | -- | -- | |
| 01/23/2021 01/23/21 | For Rent | $5,500 | +25.0% | -- | |
| 05/08/2017 05/08/17 | Rented | $4,400 | +7.3% | -- | |
| 05/08/2017 05/08/17 | Under Contract | -- | -- | -- | |
| 05/04/2017 05/04/17 | For Rent | $4,100 | 0.0% | -- | |
| 06/08/2016 06/08/16 | Sold | $993,000 | -2.6% | $245 / Sq Ft | View Prior Sale |
| 02/20/2016 02/20/16 | Pending | -- | -- | -- | |
| 11/17/2015 11/17/15 | Price Changed | $1,019,964 | -1.0% | $252 / Sq Ft | |
| 07/26/2015 07/26/15 | Price Changed | $1,029,964 | +7.1% | $255 / Sq Ft | |
| 05/19/2015 05/19/15 | Price Changed | $962,095 | +1.5% | $238 / Sq Ft | |
| 03/15/2015 03/15/15 | For Sale | $947,595 | -- | $234 / Sq Ft |
| Year | Tax Paid | Tax Assessment Tax Assessment Total Assessment is a certain percentage of the fair market value that is determined by local assessors to be the total taxable value of land and additions on the property. | Land | Improvement |
|---|---|---|---|---|
| 2025 | $18,641 | $1,452,900 | $426,400 | $1,026,500 |
| 2024 | $17,930 | $1,356,300 | $410,100 | $946,200 |
| 2023 | $16,624 | $1,196,800 | $356,500 | $840,300 |
| 2022 | $15,077 | $1,042,700 | $330,200 | $712,500 |
| 2021 | $14,975 | $1,009,100 | $311,700 | $697,400 |
| 2020 | $14,190 | $946,600 | $303,300 | $643,300 |
| 2019 | $13,890 | $919,900 | $292,000 | $627,900 |
| 2018 | $14,108 | $923,900 | $280,500 | $643,400 |
| 2017 | $13,728 | $895,500 | $269,600 | $625,900 |
| 2016 | $6,157 | $395,700 | $278,000 | $117,700 |
| 2015 | $1,083 | $69,000 | $69,000 | $0 |
| 2014 | $1,147 | $72,800 | $72,800 | $0 |
Landlord's Agent in 2025
JULIE CREMIN
William Raveis R.E. & Home Services
(781) 308-5186
1 in this area
51 Total Sales
A
Buyer's Agent in 2021
Andy Bissanti
Andrew E. Bissanti Realty
Buyer's Agent in 2017
Lori Seavey
Keller Williams Elite
(508) 446-1258
5 in this area
308 Total Sales
M
Seller's Agent in 2016
Michelle Brewster
Pulte Homes of New England
4 Total Sales
Source: MLS Property Information Network (MLS PIN)
MLS Number: 73441780
APN: WALP-000011-000084
Disclaimer: Certain information contained herein is derived from information provided by parties other than Homes.com. All information provided is deemed reliable, but is not guaranteed to be accurate and should be independently verified.
![]() The property listing data and information, or the Images, set forth herein were provided to MLS Property Information Network, Inc. from third party sources, including sellers, lessors and public records, and were compiled by MLS Property Information Network, Inc. The property listing data and information, and the Images, are for the personal, non-commercial use of consumers having a good faith interest in purchasing or leasing listed properties of the type displayed to them and may not be used for any purpose other than to identify prospective properties which such consumers may have a good faith interest in purchasing or leasing. MLS Property Information Network, Inc. and its subscribers disclaim any and all representations and warranties as to the accuracy of the property listing data and information, or as to the accuracy of any of the Images, set forth herein.
The property listing data and information, or the Images, set forth herein were provided to MLS Property Information Network, Inc. from third party sources, including sellers, lessors and public records, and were compiled by MLS Property Information Network, Inc. The property listing data and information, and the Images, are for the personal, non-commercial use of consumers having a good faith interest in purchasing or leasing listed properties of the type displayed to them and may not be used for any purpose other than to identify prospective properties which such consumers may have a good faith interest in purchasing or leasing. MLS Property Information Network, Inc. and its subscribers disclaim any and all representations and warranties as to the accuracy of the property listing data and information, or as to the accuracy of any of the Images, set forth herein.