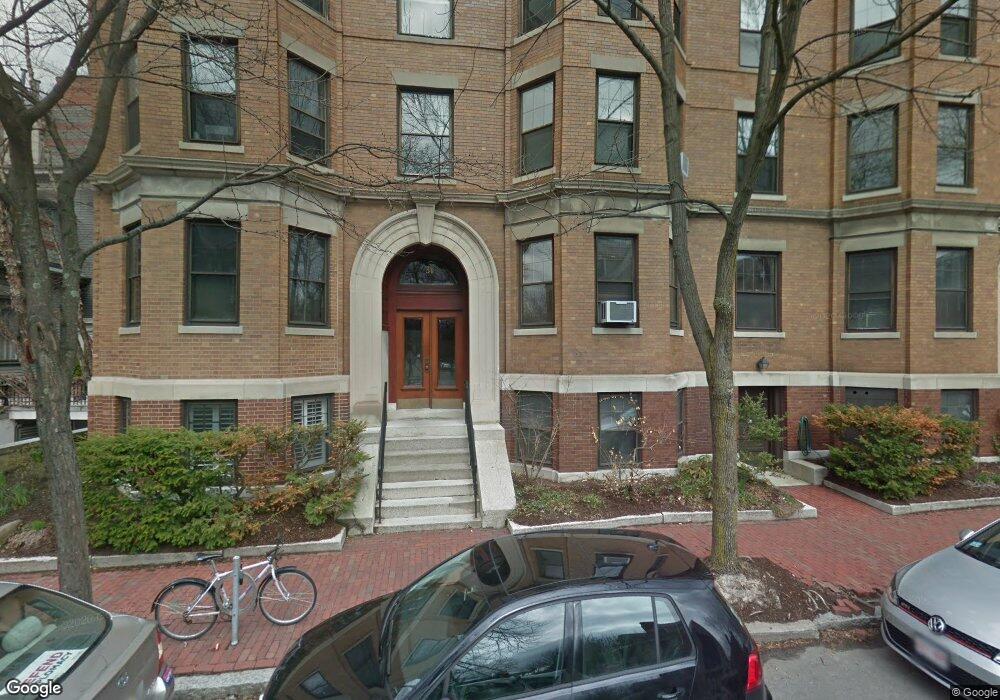
31 Linnaean St Unit 4 Cambridge, MA 02138
Neighborhood Nine NeighborhoodEstimated Value: $791,000 - $1,002,000
2
Beds
1
Bath
1,144
Sq Ft
$787/Sq Ft
Est. Value
About This Home
This home is located at 31 Linnaean St Unit 4, Cambridge, MA 02138 and is currently estimated at $900,732, approximately $787 per square foot. 31 Linnaean St Unit 4 is a home located in Middlesex County.
Ownership History
Date
Name
Owned For
Owner Type
Purchase Details
Closed on
Jul 23, 2008
Sold by
Oestreicher Marilyn E and Oestreicher Mark I
Bought by
Cope David and Badin Sandra J
Current Estimated Value
Home Financials for this Owner
Home Financials are based on the most recent Mortgage that was taken out on this home.
Original Mortgage
$388,000
Outstanding Balance
$253,839
Interest Rate
6.35%
Mortgage Type
Purchase Money Mortgage
Estimated Equity
$646,893
Purchase Details
Closed on
Oct 1, 2001
Sold by
Raih Deanna K
Bought by
Oestreicher Mark I and Oestreicher Marilyn E
Purchase Details
Closed on
Jul 28, 1994
Sold by
March Elizabeth L
Bought by
Raih Deanna K
Home Financials for this Owner
Home Financials are based on the most recent Mortgage that was taken out on this home.
Original Mortgage
$194,400
Interest Rate
8.25%
Mortgage Type
Purchase Money Mortgage
Create a Home Valuation Report for This Property
The Home Valuation Report is an in-depth analysis detailing your home's value as well as a comparison with similar homes in the area
Home Values in the Area
Average Home Value in this Area
Purchase History
| Date | Buyer | Sale Price | Title Company |
|---|---|---|---|
| Cope David | $485,000 | -- | |
| Oestreicher Mark I | $419,000 | -- | |
| Raih Deanna K | $216,000 | -- |
Source: Public Records
Mortgage History
| Date | Status | Borrower | Loan Amount |
|---|---|---|---|
| Open | Cope David | $388,000 | |
| Previous Owner | Raih Deanna K | $189,100 | |
| Previous Owner | Raih Deanna K | $194,400 |
Source: Public Records
Tax History Compared to Growth
Tax History
| Year | Tax Paid | Tax Assessment Tax Assessment Total Assessment is a certain percentage of the fair market value that is determined by local assessors to be the total taxable value of land and additions on the property. | Land | Improvement |
|---|---|---|---|---|
| 2025 | $5,823 | $917,000 | $0 | $917,000 |
| 2024 | $5,414 | $914,600 | $0 | $914,600 |
| 2023 | $5,167 | $881,800 | $0 | $881,800 |
| 2022 | $5,194 | $877,400 | $0 | $877,400 |
| 2021 | $5,084 | $869,100 | $0 | $869,100 |
| 2020 | $4,832 | $840,400 | $0 | $840,400 |
| 2019 | $4,625 | $778,700 | $0 | $778,700 |
| 2018 | $4,489 | $713,700 | $0 | $713,700 |
| 2017 | $4,333 | $667,600 | $0 | $667,600 |
| 2016 | $4,216 | $603,100 | $0 | $603,100 |
| 2015 | $4,168 | $533,000 | $0 | $533,000 |
| 2014 | $4,098 | $489,000 | $0 | $489,000 |
Source: Public Records
Map
Nearby Homes
- 43 Linnaean St Unit 42
- 22 Agassiz St
- 86 Avon Hill St
- 3 Arlington St Unit 52
- 69A Walker St Unit A
- 202 Garden St
- 24 Cambridge Terrace Unit 2
- 84 Garden St
- 9 Chauncy St Unit 61
- 15-15A Forest St
- 13 Mellen St Unit Front
- 52 Garden St Unit B2
- 1 Richdale Ave Unit 2
- 1600 Massachusetts Ave Unit 404
- 44 Garden St
- 12-14 Gray Gardens W
- 31-33 Mellen St
- 35 Mellen St
- 72 Oxford St Unit 72
- 72 Oxford St
- 31 Linnaean St Unit A
- 31 Linnaean St Unit 6
- 31 Linnaean St Unit 5
- 31 Linnaean St Unit 3
- 31 Linnaean St Unit 2
- 31 Linnaean St Unit 1
- 31 Linnaean St
- 27 Linnaean St Unit A
- 27 Linnaean St Unit 6
- 27 Linnaean St Unit 5
- 27 Linnaean St Unit 4
- 27 Linnaean St Unit 3
- 27 Linnaean St Unit 2
- 27 Linnaean St Unit 1
- 27 Linnaean St
- 27 Linnaean St Unit 27A, 1
- 9 Washington Ave Unit 6A
- 9 Washington Ave Unit 5A
- 9 Washington Ave Unit B
- 9 Washington Ave Unit 4