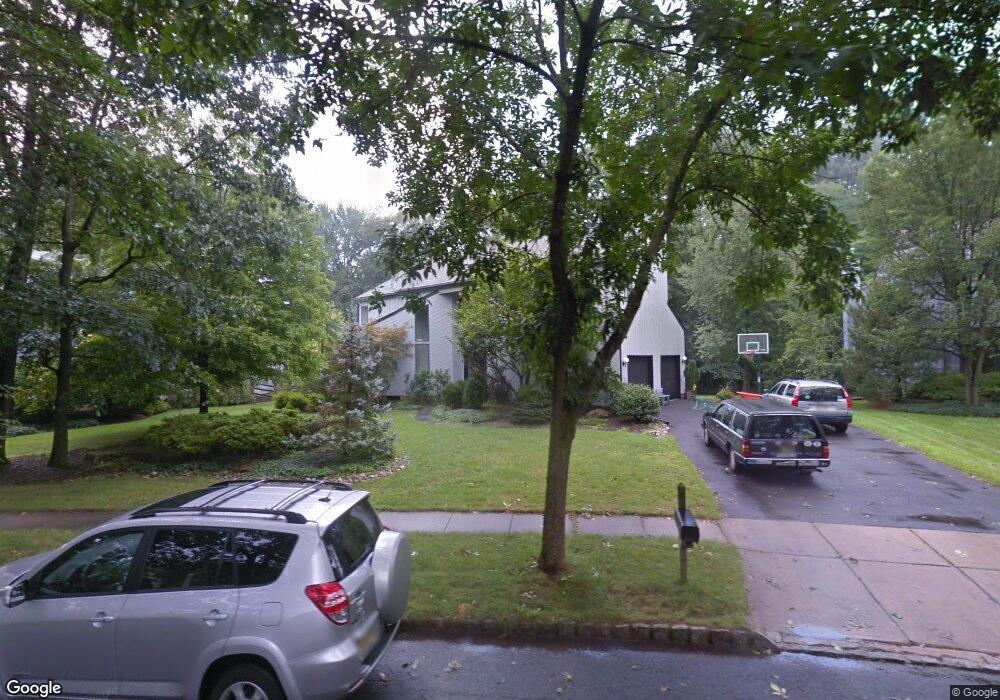
31 Lorrie Ln Princeton Junction, NJ 08550
Estimated Value: $1,215,023 - $1,355,000
--
Bed
--
Bath
3,602
Sq Ft
$352/Sq Ft
Est. Value
About This Home
This home is located at 31 Lorrie Ln, Princeton Junction, NJ 08550 and is currently estimated at $1,269,006, approximately $352 per square foot. 31 Lorrie Ln is a home located in Mercer County with nearby schools including Maurice Hawk Elementary School, Village Elementary School, and Thomas R. Grover Middle School.
Ownership History
Date
Name
Owned For
Owner Type
Purchase Details
Closed on
May 31, 1998
Sold by
Boetes Gary
Bought by
Steinhauser Steven and Azarchi Lynn
Current Estimated Value
Home Financials for this Owner
Home Financials are based on the most recent Mortgage that was taken out on this home.
Original Mortgage
$340,000
Outstanding Balance
$68,255
Interest Rate
7.09%
Mortgage Type
Purchase Money Mortgage
Estimated Equity
$1,200,751
Purchase Details
Closed on
Nov 16, 1989
Sold by
Sunrise East Of Princeton
Bought by
Boetes Gary L and Boetes Anker-,Debbie
Create a Home Valuation Report for This Property
The Home Valuation Report is an in-depth analysis detailing your home's value as well as a comparison with similar homes in the area
Home Values in the Area
Average Home Value in this Area
Purchase History
| Date | Buyer | Sale Price | Title Company |
|---|---|---|---|
| Steinhauser Steven | $425,000 | -- | |
| Boetes Gary L | $390,500 | -- |
Source: Public Records
Mortgage History
| Date | Status | Borrower | Loan Amount |
|---|---|---|---|
| Open | Steinhauser Steven | $340,000 |
Source: Public Records
Tax History Compared to Growth
Tax History
| Year | Tax Paid | Tax Assessment Tax Assessment Total Assessment is a certain percentage of the fair market value that is determined by local assessors to be the total taxable value of land and additions on the property. | Land | Improvement |
|---|---|---|---|---|
| 2025 | $20,851 | $680,300 | $238,100 | $442,200 |
| 2024 | $19,980 | $680,300 | $238,100 | $442,200 |
| 2023 | $19,980 | $680,300 | $238,100 | $442,200 |
| 2022 | $19,593 | $680,300 | $238,100 | $442,200 |
| 2021 | $19,429 | $680,300 | $238,100 | $442,200 |
| 2020 | $19,076 | $680,300 | $238,100 | $442,200 |
| 2019 | $18,858 | $680,300 | $238,100 | $442,200 |
| 2018 | $18,681 | $680,300 | $238,100 | $442,200 |
| 2017 | $18,293 | $680,300 | $238,100 | $442,200 |
| 2016 | $17,899 | $680,300 | $238,100 | $442,200 |
| 2015 | $17,484 | $680,300 | $238,100 | $442,200 |
| 2014 | $17,280 | $680,300 | $238,100 | $442,200 |
Source: Public Records
Map
Nearby Homes