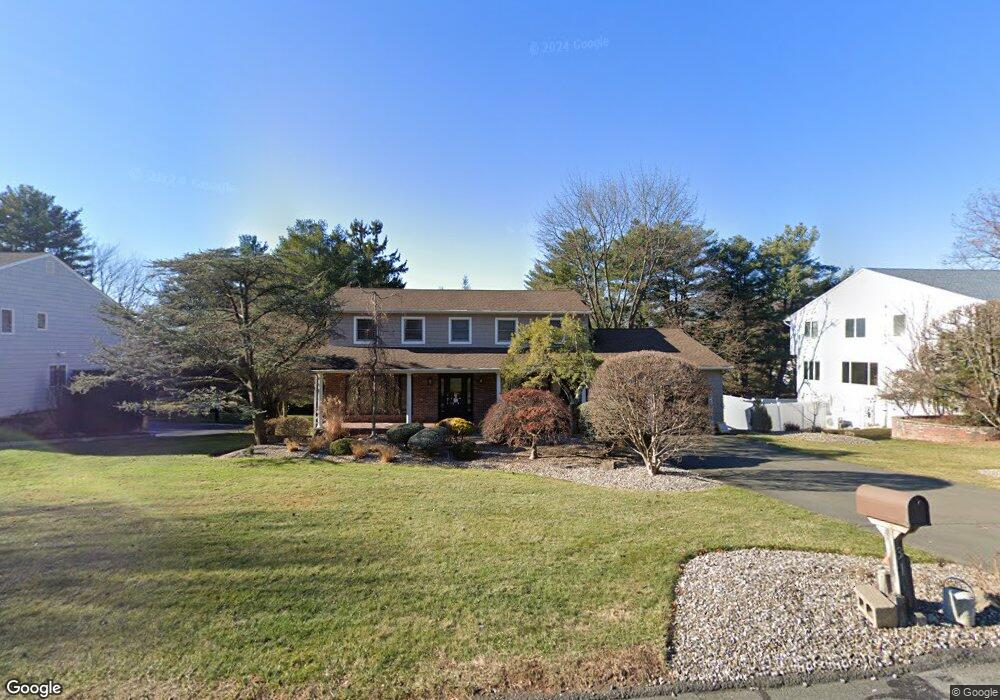
31 Lyncrest Dr Monsey, NY 10952
Estimated Value: $555,532 - $1,289,000
4
Beds
3
Baths
2,729
Sq Ft
$386/Sq Ft
Est. Value
About This Home
This home is located at 31 Lyncrest Dr, Monsey, NY 10952 and is currently estimated at $1,054,133, approximately $386 per square foot. 31 Lyncrest Dr is a home located in Rockland County with nearby schools including Grandview Elementary School, Pomona Middle School, and Ramapo High School.
Ownership History
Date
Name
Owned For
Owner Type
Purchase Details
Closed on
Aug 15, 2005
Sold by
Kaplan Elissa
Bought by
Samuels Debra
Current Estimated Value
Home Financials for this Owner
Home Financials are based on the most recent Mortgage that was taken out on this home.
Original Mortgage
$532,000
Outstanding Balance
$279,826
Interest Rate
5.68%
Mortgage Type
Fannie Mae Freddie Mac
Estimated Equity
$774,307
Purchase Details
Closed on
Jun 29, 2003
Sold by
Kaplan Elissa Greenberg and Greenberg Michael
Bought by
Kaplan Elissa Greenberg and Greenberg Michael
Create a Home Valuation Report for This Property
The Home Valuation Report is an in-depth analysis detailing your home's value as well as a comparison with similar homes in the area
Home Values in the Area
Average Home Value in this Area
Purchase History
| Date | Buyer | Sale Price | Title Company |
|---|---|---|---|
| Samuels Debra | $760,000 | Rosenfeld & Maidenbaum | |
| Samuels Debra | $760,000 | National Granite Title | |
| Kaplan Elissa Greenberg | -- | -- |
Source: Public Records
Mortgage History
| Date | Status | Borrower | Loan Amount |
|---|---|---|---|
| Open | Samuels Debra | $532,000 | |
| Closed | Samuels Debra | $76,000 |
Source: Public Records
Tax History Compared to Growth
Tax History
| Year | Tax Paid | Tax Assessment Tax Assessment Total Assessment is a certain percentage of the fair market value that is determined by local assessors to be the total taxable value of land and additions on the property. | Land | Improvement |
|---|---|---|---|---|
| 2024 | $18,834 | $77,800 | $17,300 | $60,500 |
| 2023 | $18,834 | $77,800 | $17,300 | $60,500 |
| 2022 | $18,082 | $77,800 | $17,300 | $60,500 |
| 2021 | $18,082 | $77,800 | $17,300 | $60,500 |
| 2020 | $17,639 | $77,800 | $17,300 | $60,500 |
| 2019 | $17,947 | $77,800 | $17,300 | $60,500 |
| 2018 | $17,947 | $77,800 | $17,300 | $60,500 |
| 2017 | $17,601 | $77,800 | $17,300 | $60,500 |
| 2016 | $17,422 | $77,800 | $17,300 | $60,500 |
| 2015 | -- | $77,800 | $17,300 | $60,500 |
| 2014 | -- | $77,800 | $17,300 | $60,500 |
Source: Public Records
Map
Nearby Homes