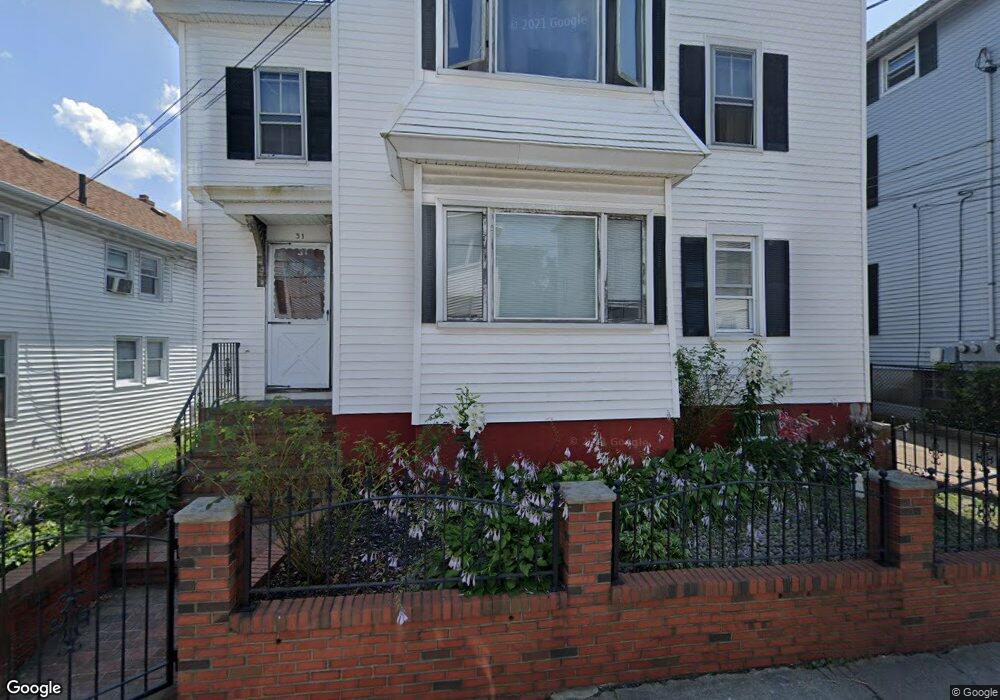
31 Lyon St Fall River, MA 02721
Corky Row NeighborhoodEstimated Value: $464,890 - $666,000
6
Beds
2
Baths
3,091
Sq Ft
$187/Sq Ft
Est. Value
About This Home
This home is located at 31 Lyon St, Fall River, MA 02721 and is currently estimated at $578,973, approximately $187 per square foot. 31 Lyon St is a home located in Bristol County with nearby schools including Henry Lord Community School, B M C Durfee High School, and Argosy Collegiate Charter School.
Ownership History
Date
Name
Owned For
Owner Type
Purchase Details
Closed on
Sep 27, 2002
Sold by
Borges Jorge J and Borges Valentina F
Bought by
Gonzales Carmelly and Medina Nelson I
Current Estimated Value
Home Financials for this Owner
Home Financials are based on the most recent Mortgage that was taken out on this home.
Original Mortgage
$155,200
Outstanding Balance
$65,494
Interest Rate
6.25%
Mortgage Type
Purchase Money Mortgage
Estimated Equity
$513,479
Create a Home Valuation Report for This Property
The Home Valuation Report is an in-depth analysis detailing your home's value as well as a comparison with similar homes in the area
Home Values in the Area
Average Home Value in this Area
Purchase History
| Date | Buyer | Sale Price | Title Company |
|---|---|---|---|
| Gonzales Carmelly | $160,000 | -- |
Source: Public Records
Mortgage History
| Date | Status | Borrower | Loan Amount |
|---|---|---|---|
| Open | Gonzales Carmelly | $40,000 | |
| Open | Gonzales Carmelly | $155,200 | |
| Previous Owner | Gonzales Carmelly | $60,000 |
Source: Public Records
Tax History
| Year | Tax Paid | Tax Assessment Tax Assessment Total Assessment is a certain percentage of the fair market value that is determined by local assessors to be the total taxable value of land and additions on the property. | Land | Improvement |
|---|---|---|---|---|
| 2025 | $5,301 | $463,000 | $106,600 | $356,400 |
| 2024 | $4,822 | $419,700 | $102,700 | $317,000 |
| 2023 | $4,375 | $356,600 | $84,800 | $271,800 |
| 2022 | $4,026 | $319,000 | $80,800 | $238,200 |
| 2021 | $3,675 | $265,700 | $76,900 | $188,800 |
| 2020 | $3,254 | $225,200 | $75,700 | $149,500 |
| 2019 | $3,072 | $210,700 | $72,900 | $137,800 |
| 2018 | $2,838 | $194,100 | $79,000 | $115,100 |
| 2017 | $2,569 | $183,500 | $75,300 | $108,200 |
| 2016 | $2,526 | $185,300 | $80,100 | $105,200 |
| 2015 | $2,424 | $185,300 | $80,100 | $105,200 |
| 2014 | $2,432 | $193,300 | $77,800 | $115,500 |
Source: Public Records
Map
Nearby Homes
Your Personal Tour Guide
Ask me questions while you tour the home.