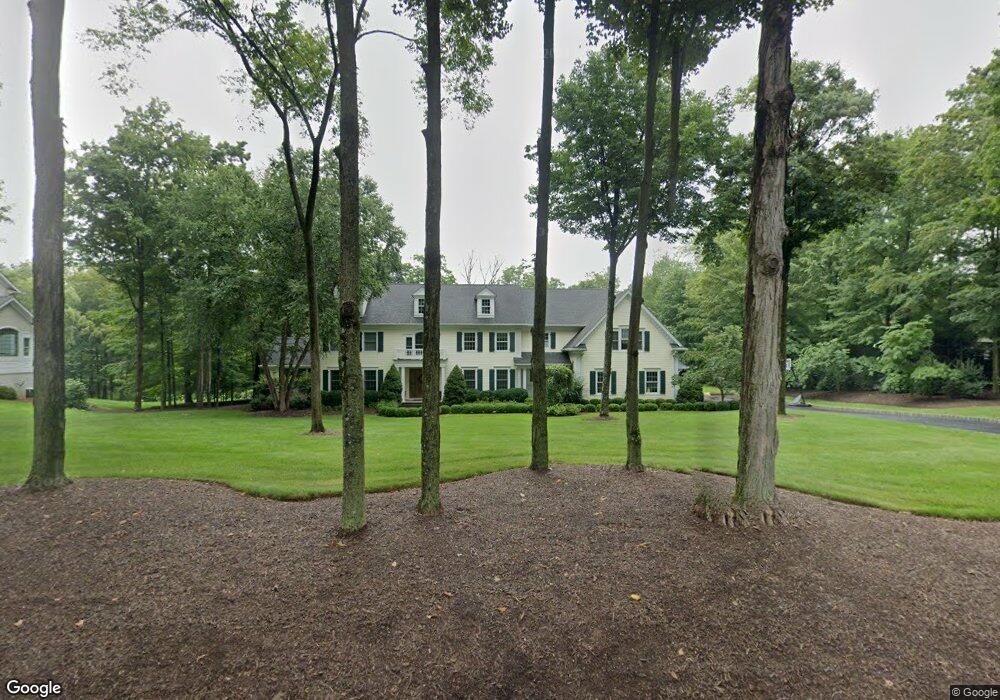
31 Lyons Place Basking Ridge, NJ 07920
Bernards NeighborhoodEstimated Value: $1,648,000 - $2,290,000
Studio
--
Bath
4,690
Sq Ft
$446/Sq Ft
Est. Value
About This Home
This home is located at 31 Lyons Place, Basking Ridge, NJ 07920 and is currently estimated at $2,093,165, approximately $446 per square foot. 31 Lyons Place is a home located in Somerset County with nearby schools including Cedar Hill Elementary School, William Annin Middle School, and Ridge High School.
Ownership History
Date
Name
Owned For
Owner Type
Purchase Details
Closed on
May 22, 2015
Sold by
Sell Adam
Bought by
Sell Adam and Sell Sarah Joy
Current Estimated Value
Purchase Details
Closed on
Aug 11, 2006
Sold by
Hanretta Michael J
Bought by
Sell Adam
Home Financials for this Owner
Home Financials are based on the most recent Mortgage that was taken out on this home.
Original Mortgage
$500,000
Outstanding Balance
$287,610
Interest Rate
6%
Mortgage Type
Adjustable Rate Mortgage/ARM
Estimated Equity
$1,805,555
Purchase Details
Closed on
May 16, 2003
Sold by
Renz David
Bought by
Hanretta Michael and Hanretta Toni
Home Financials for this Owner
Home Financials are based on the most recent Mortgage that was taken out on this home.
Original Mortgage
$526,000
Interest Rate
5.84%
Create a Home Valuation Report for This Property
The Home Valuation Report is an in-depth analysis detailing your home's value as well as a comparison with similar homes in the area
Home Values in the Area
Average Home Value in this Area
Purchase History
| Date | Buyer | Sale Price | Title Company |
|---|---|---|---|
| Sell Adam | -- | Attorney | |
| Sell Adam | $775,000 | -- | |
| Sell Adam | $775,000 | None Available | |
| Hanretta Michael | $657,500 | -- |
Source: Public Records
Mortgage History
| Date | Status | Borrower | Loan Amount |
|---|---|---|---|
| Open | Sell Adam | $500,000 | |
| Closed | Sell Adam | $500,000 | |
| Previous Owner | Hanretta Michael | $526,000 |
Source: Public Records
Tax History
| Year | Tax Paid | Tax Assessment Tax Assessment Total Assessment is a certain percentage of the fair market value that is determined by local assessors to be the total taxable value of land and additions on the property. | Land | Improvement |
|---|---|---|---|---|
| 2025 | $32,285 | $1,940,900 | $400,500 | $1,540,400 |
| 2024 | $32,285 | $1,814,800 | $370,500 | $1,444,300 |
Source: Public Records
Map
Nearby Homes
- 36 Debra Ln
- 247 Lyons Rd
- 7 Valley View Dr
- 14 Bradford Ln
- 4 Owen Ct
- 12 Wayne Terrace
- 24 Chelsea Ct
- 33 Juniper Way
- 40 Chestnut Ct
- 275 Crabtree Ct
- 49 Alexandria Way Ondo
- 20 Alexandria Way
- 85 Sycamore Ct Ondo
- 195 Alexandria Way
- 22 Alexandria Way
- 173 W Oak St
- 28 Lafayette Ln
- 46 Smithfield Ct
- 206 Potomac Dr
- 62 Smithfield Ct
Your Personal Tour Guide
Ask me questions while you tour the home.