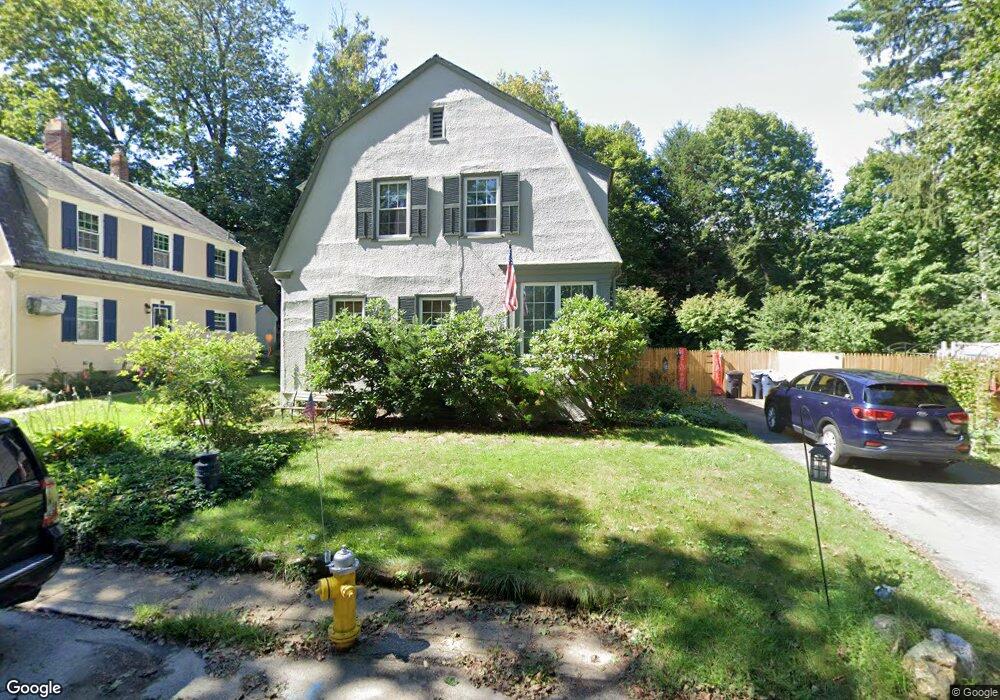
31 Maple St Southbridge, MA 01550
Estimated Value: $342,000 - $368,000
4
Beds
2
Baths
1,602
Sq Ft
$220/Sq Ft
Est. Value
About This Home
This home is located at 31 Maple St, Southbridge, MA 01550 and is currently estimated at $353,206, approximately $220 per square foot. 31 Maple St is a home located in Worcester County with nearby schools including Trinity Catholic Academy and ViewPoint Christian Academy.
Ownership History
Date
Name
Owned For
Owner Type
Purchase Details
Closed on
Sep 3, 2013
Sold by
Sabatinelli Anthony H and Sebatinell Sharon A
Bought by
Anthony and Anthony Sabatinelli S
Current Estimated Value
Purchase Details
Closed on
Aug 12, 1986
Bought by
Anthony & S Sabatinelli Irt
Create a Home Valuation Report for This Property
The Home Valuation Report is an in-depth analysis detailing your home's value as well as a comparison with similar homes in the area
Home Values in the Area
Average Home Value in this Area
Purchase History
| Date | Buyer | Sale Price | Title Company |
|---|---|---|---|
| Anthony | -- | -- | |
| Anthony | -- | -- | |
| Anthony & S Sabatinelli Irt | $25,000 | -- |
Source: Public Records
Mortgage History
| Date | Status | Borrower | Loan Amount |
|---|---|---|---|
| Previous Owner | Anthony & S Sabatinelli Irt | $37,000 | |
| Previous Owner | Anthony & S Sabatinelli Irt | $50,000 | |
| Previous Owner | Anthony & S Sabatinelli Irt | $15,000 |
Source: Public Records
Tax History
| Year | Tax Paid | Tax Assessment Tax Assessment Total Assessment is a certain percentage of the fair market value that is determined by local assessors to be the total taxable value of land and additions on the property. | Land | Improvement |
|---|---|---|---|---|
| 2025 | $4,619 | $315,100 | $33,400 | $281,700 |
| 2024 | $4,984 | $326,600 | $27,800 | $298,800 |
| 2023 | $4,693 | $296,300 | $27,800 | $268,500 |
| 2022 | $4,491 | $250,900 | $23,800 | $227,100 |
| 2021 | $4,415 | $227,100 | $23,800 | $203,300 |
| 2020 | $3,865 | $198,400 | $23,800 | $174,600 |
| 2018 | $3,664 | $176,600 | $21,100 | $155,500 |
| 2017 | $3,431 | $166,800 | $21,100 | $145,700 |
| 2016 | $3,371 | $166,800 | $21,100 | $145,700 |
| 2015 | $3,290 | $161,600 | $21,100 | $140,500 |
| 2014 | $3,174 | $161,600 | $21,100 | $140,500 |
Source: Public Records
Map
Nearby Homes
- 7 Pearl St
- 0 Blackmer Rd
- 112 Chestnut St
- 135 Elm St
- 128 & 128 1 2 Elm St
- 140 Hamilton St
- 21 Edwards St
- 24 Caron St
- 269 Mechanic St
- 89 Worcester St
- 97 Worcester St
- 219 Charlton St
- Lots 25-27 Dennison Ln
- 24 Mary Ellen Ln
- 0 Brentwood Dr
- 5 Oliver St
- 0 Old North Woodstock Rd
- 20 Glover St
- 723 Main St
- 127 Cliff St