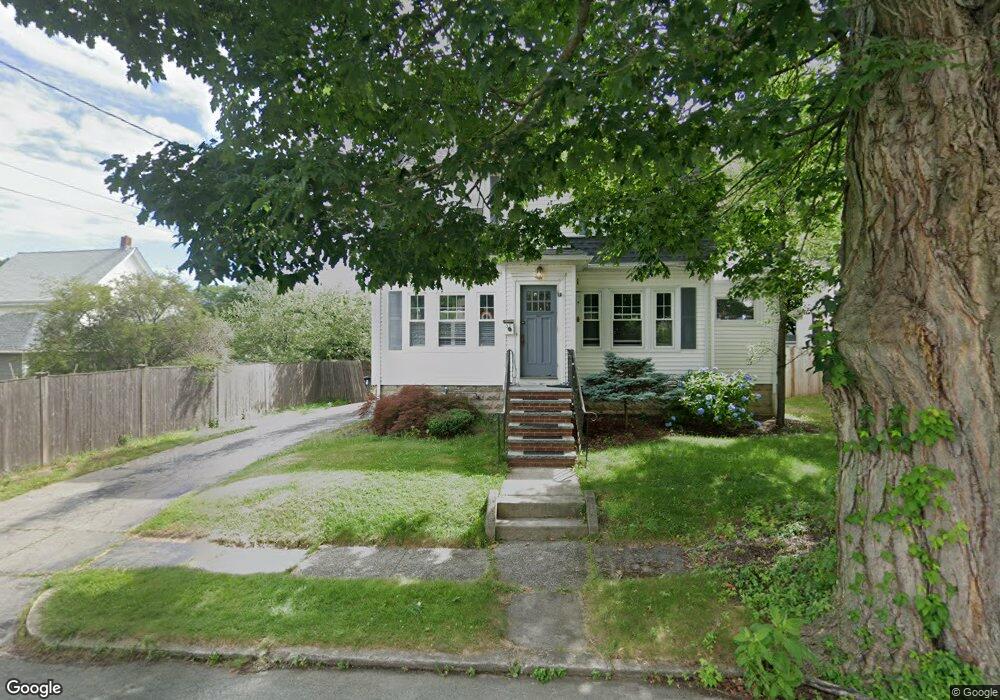
31 Martin St Whitman, MA 02382
Estimated Value: $556,020 - $639,000
4
Beds
2
Baths
2,039
Sq Ft
$295/Sq Ft
Est. Value
About This Home
This home is located at 31 Martin St, Whitman, MA 02382 and is currently estimated at $601,005, approximately $294 per square foot. 31 Martin St is a home located in Plymouth County with nearby schools including St Bridget School.
Ownership History
Date
Name
Owned For
Owner Type
Purchase Details
Closed on
Dec 26, 2012
Sold by
Thompson Teresa
Bought by
Keenan Teresa M and Taraska Edward T
Current Estimated Value
Home Financials for this Owner
Home Financials are based on the most recent Mortgage that was taken out on this home.
Original Mortgage
$249,343
Outstanding Balance
$173,450
Interest Rate
3.38%
Mortgage Type
New Conventional
Estimated Equity
$427,555
Purchase Details
Closed on
Aug 27, 2004
Sold by
Stanton Richard J and Stanton Norma B
Bought by
Thompson Teresa
Home Financials for this Owner
Home Financials are based on the most recent Mortgage that was taken out on this home.
Original Mortgage
$50,000
Interest Rate
6.02%
Create a Home Valuation Report for This Property
The Home Valuation Report is an in-depth analysis detailing your home's value as well as a comparison with similar homes in the area
Home Values in the Area
Average Home Value in this Area
Purchase History
| Date | Buyer | Sale Price | Title Company |
|---|---|---|---|
| Keenan Teresa M | -- | -- | |
| Thompson Teresa | $354,900 | -- |
Source: Public Records
Mortgage History
| Date | Status | Borrower | Loan Amount |
|---|---|---|---|
| Open | Keenan Teresa M | $249,343 | |
| Previous Owner | Thompson Teresa | $275,000 | |
| Previous Owner | Thompson Teresa | $50,000 |
Source: Public Records
Tax History
| Year | Tax Paid | Tax Assessment Tax Assessment Total Assessment is a certain percentage of the fair market value that is determined by local assessors to be the total taxable value of land and additions on the property. | Land | Improvement |
|---|---|---|---|---|
| 2025 | $6,400 | $487,800 | $203,000 | $284,800 |
| 2024 | $6,054 | $475,200 | $199,100 | $276,100 |
| 2023 | $5,659 | $417,000 | $172,600 | $244,400 |
| 2022 | $5,581 | $383,300 | $156,900 | $226,400 |
| 2021 | $5,354 | $345,400 | $144,200 | $201,200 |
| 2020 | $5,142 | $324,400 | $130,400 | $194,000 |
| 2019 | $4,934 | $320,800 | $130,400 | $190,400 |
| 2018 | $4,595 | $287,000 | $123,600 | $163,400 |
| 2017 | $4,328 | $287,000 | $123,600 | $163,400 |
| 2016 | $4,242 | $272,100 | $117,700 | $154,400 |
| 2015 | $4,429 | $283,700 | $117,700 | $166,000 |
Source: Public Records
Map
Nearby Homes
- 42 Rock St
- 118 Temple St
- 95 Temple St
- 56-58 Vernon St
- 8 Laurel St
- 110 South Ave
- 66 Belmont St
- 48 Day St
- 48 Sullivan Terrace
- 147 South Ave
- 150 Harvard St
- 300 High St
- 1190 Bedford St Unit G3
- 159 Auburn St
- 157 Auburn St Unit 157
- 501 Auburn St Unit 508
- 289 Commercial St
- 603 Temple St
- 154 Auburn St
- 262 Homeland Dr
Your Personal Tour Guide
Ask me questions while you tour the home.