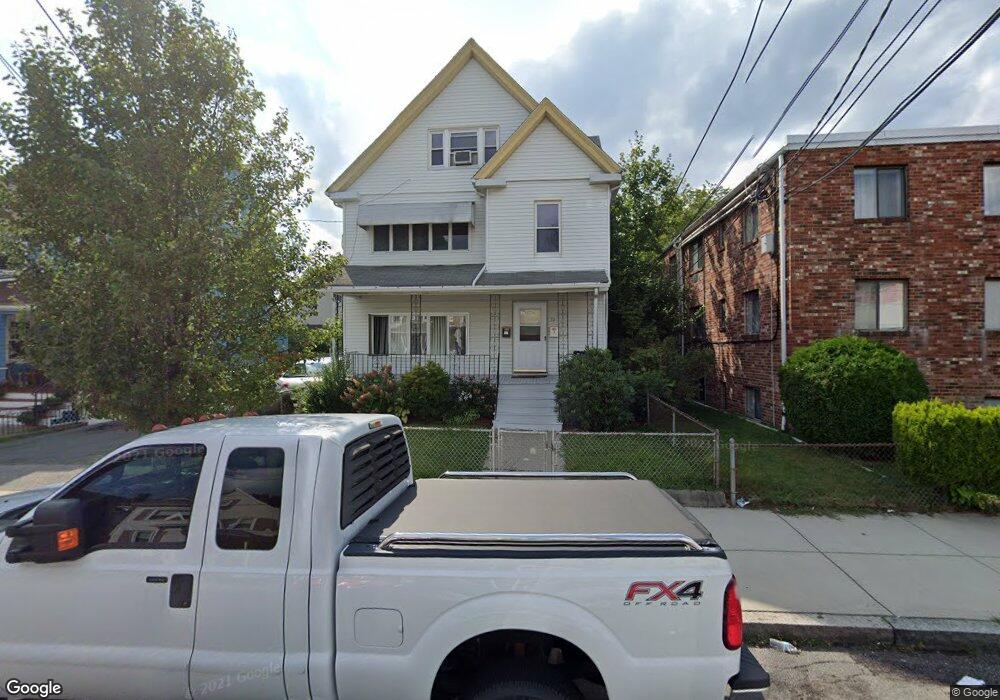
31 Myrtle St Unit 1 Malden, MA 02148
Maplewood NeighborhoodEstimated Value: $829,547 - $1,178,000
2
Beds
1
Bath
1,100
Sq Ft
$857/Sq Ft
Est. Value
About This Home
This home is located at 31 Myrtle St Unit 1, Malden, MA 02148 and is currently estimated at $942,887, approximately $857 per square foot. 31 Myrtle St Unit 1 is a home located in Middlesex County with nearby schools including Malden High School, Cheverus Catholic School, and Malden Catholic.
Ownership History
Date
Name
Owned For
Owner Type
Purchase Details
Closed on
Dec 6, 2021
Sold by
Abay Abel and Asrat Tigist A
Bought by
Asrat Tigist A
Current Estimated Value
Home Financials for this Owner
Home Financials are based on the most recent Mortgage that was taken out on this home.
Original Mortgage
$199,000
Outstanding Balance
$183,891
Interest Rate
3.14%
Mortgage Type
Stand Alone Refi Refinance Of Original Loan
Estimated Equity
$758,996
Purchase Details
Closed on
Jan 25, 2020
Sold by
Abay Abel
Bought by
Abay Abel and Asrat Tigist A
Purchase Details
Closed on
Mar 23, 2010
Sold by
Buckus Bryan E and First Tennessee Bank N
Bought by
Abay Abel
Home Financials for this Owner
Home Financials are based on the most recent Mortgage that was taken out on this home.
Original Mortgage
$246,551
Interest Rate
5.25%
Mortgage Type
FHA
Purchase Details
Closed on
Jul 21, 1998
Sold by
Est Mcgrath Virginia A and Mcgrath Evelyn R
Bought by
Buckus Bryan E
Create a Home Valuation Report for This Property
The Home Valuation Report is an in-depth analysis detailing your home's value as well as a comparison with similar homes in the area
Home Values in the Area
Average Home Value in this Area
Purchase History
| Date | Buyer | Sale Price | Title Company |
|---|---|---|---|
| Asrat Tigist A | -- | None Available | |
| Asrat Tigist A | -- | None Available | |
| Abay Abel | -- | None Available | |
| Abay Abel | $251,100 | -- | |
| Abay Abel | $251,100 | -- | |
| Buckus Bryan E | $130,000 | -- | |
| Buckus Bryan E | $130,000 | -- |
Source: Public Records
Mortgage History
| Date | Status | Borrower | Loan Amount |
|---|---|---|---|
| Open | Asrat Tigist A | $199,000 | |
| Previous Owner | Abay Abel | $246,551 | |
| Previous Owner | Buckus Bryan E | $96,100 | |
| Previous Owner | Buckus Bryan E | $60,000 |
Source: Public Records
Tax History Compared to Growth
Tax History
| Year | Tax Paid | Tax Assessment Tax Assessment Total Assessment is a certain percentage of the fair market value that is determined by local assessors to be the total taxable value of land and additions on the property. | Land | Improvement |
|---|---|---|---|---|
| 2025 | $85 | $746,600 | $296,200 | $450,400 |
| 2024 | $8,218 | $703,000 | $280,200 | $422,800 |
| 2023 | $7,953 | $652,400 | $256,200 | $396,200 |
| 2022 | $7,600 | $615,400 | $232,100 | $383,300 |
| 2021 | $7,317 | $595,400 | $212,100 | $383,300 |
| 2020 | $7,055 | $557,700 | $201,700 | $356,000 |
| 2019 | $6,724 | $506,700 | $192,100 | $314,600 |
| 2018 | $6,467 | $459,000 | $162,100 | $296,900 |
| 2017 | $6,303 | $444,800 | $162,100 | $282,700 |
| 2016 | $6,032 | $397,900 | $154,100 | $243,800 |
| 2015 | $5,757 | $366,000 | $145,300 | $220,700 |
| 2014 | $5,339 | $331,600 | $132,100 | $199,500 |
Source: Public Records
Map
Nearby Homes
- 115 Webster St
- 14 Dodge St
- 15 Mount Washington Ave
- 26 Webber St Unit 1
- 33 Lodgen Ct Unit 4G
- 31 Preston St
- 363 Broadway
- 7 Sawyer Ct
- 188-190 Sylvan St
- 48 Summit St
- 3 Nira St
- 10 Birch Ln
- 98 Summit St
- 18 Lynn St
- 37 Greenhalge Ave
- 19 Bellvale St
- 1135 Salem St
- 112 Hadley St
- 0 Beachview Ave
- 56 Rocky Nook Unit 56
- 31 Myrtle St
- 31 Myrtle St Unit 5
- 37 Myrtle St
- 37 Myrtle St Unit 5
- 21 Myrtle St Unit 3
- 21 Myrtle St
- 21 Myrtle St
- 21 Myrtle St Unit Myrtle
- 21 Myrtle St
- 21 Myrtle St Unit 1
- 21 Myrtle St Unit 5
- 21 Myrtle St Unit 9
- 21 Myrtle St Unit 2
- 21 Myrtle St Unit 11
- 21 Myrtle St Unit 8
- 21 Myrtle St Unit 6
- 21 Myrtle St Unit 10
- 21 Myrtle St Unit 4
- 18 Maplewood St
- 32 Myrtle St