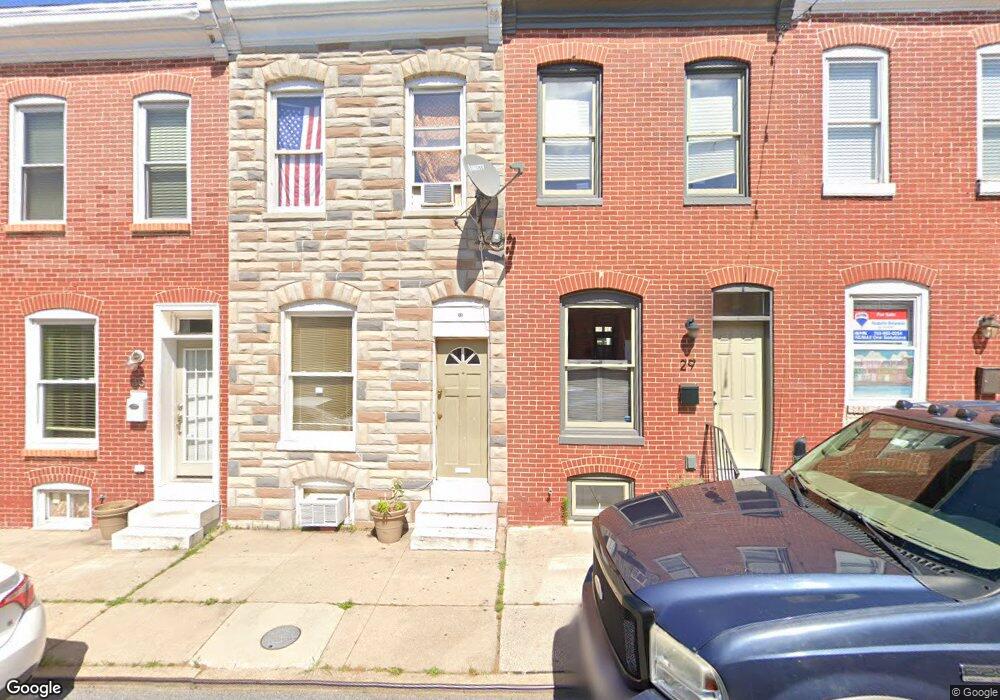
31 N Curley St Baltimore, MD 21224
Patterson Park NeighborhoodEstimated Value: $151,000 - $185,501
1
Bed
1
Bath
1,008
Sq Ft
$167/Sq Ft
Est. Value
About This Home
This home is located at 31 N Curley St, Baltimore, MD 21224 and is currently estimated at $168,251, approximately $166 per square foot. 31 N Curley St is a home located in Baltimore City with nearby schools including Highlandtown Elementary/Middle School No. 215, Booker T. Washington Middle School, and Paul Laurence Dunbar High School.
Ownership History
Date
Name
Owned For
Owner Type
Purchase Details
Closed on
Jun 4, 2010
Sold by
Waite Properties Llc
Bought by
116 North Highland Land Trust
Current Estimated Value
Purchase Details
Closed on
May 27, 2005
Sold by
Crispell Eric C
Bought by
Waite Properties Llc
Purchase Details
Closed on
Jul 24, 2003
Sold by
Henderson Kasey
Bought by
Crispell Eric C and Crispell Mary E
Purchase Details
Closed on
Sep 6, 2000
Sold by
Rhubar Mark
Bought by
Moore Elicia
Purchase Details
Closed on
Jun 30, 2000
Sold by
Fisher Jefrey B
Bought by
First National Bank Of and Chicago ,
Purchase Details
Closed on
Sep 8, 1998
Sold by
Stylus International
Bought by
Friedmann Joseph
Purchase Details
Closed on
Jul 10, 1998
Sold by
Marski John W
Bought by
Stylus International and Funding Group, Llc
Create a Home Valuation Report for This Property
The Home Valuation Report is an in-depth analysis detailing your home's value as well as a comparison with similar homes in the area
Home Values in the Area
Average Home Value in this Area
Purchase History
| Date | Buyer | Sale Price | Title Company |
|---|---|---|---|
| 116 North Highland Land Trust | $45,000 | -- | |
| Waite Properties Llc | $91,000 | -- | |
| Crispell Eric C | $53,400 | -- | |
| Henderson Kasey | $31,000 | -- | |
| Bank Of America | $24,900 | -- | |
| Moore Elicia | $50,000 | -- | |
| First National Bank Of | $23,500 | -- | |
| Fisher Jefrey B | -- | -- | |
| Friedmann Joseph | $55,000 | -- | |
| Stylus International | $15,900 | -- |
Source: Public Records
Tax History Compared to Growth
Tax History
| Year | Tax Paid | Tax Assessment Tax Assessment Total Assessment is a certain percentage of the fair market value that is determined by local assessors to be the total taxable value of land and additions on the property. | Land | Improvement |
|---|---|---|---|---|
| 2025 | $3,112 | $139,200 | $50,000 | $89,200 |
| 2024 | $3,112 | $132,500 | $0 | $0 |
| 2023 | $2,955 | $125,800 | $0 | $0 |
| 2022 | $2,811 | $119,100 | $50,000 | $69,100 |
| 2021 | $2,720 | $115,267 | $0 | $0 |
| 2020 | $2,630 | $111,433 | $0 | $0 |
| 2019 | $2,527 | $107,600 | $50,000 | $57,600 |
| 2018 | $2,539 | $107,600 | $50,000 | $57,600 |
| 2017 | $2,539 | $107,600 | $0 | $0 |
| 2016 | $2,088 | $107,600 | $0 | $0 |
| 2015 | $2,088 | $107,600 | $0 | $0 |
| 2014 | $2,088 | $107,600 | $0 | $0 |
Source: Public Records
Map
Nearby Homes
- 113 N Curley St
- 119 N Curley St
- 128 N Curley St
- 112 N Decker Ave
- 149 N Potomac St
- 102 N Ellwood Ave
- 2820 E Baltimore St
- 122 N Ellwood Ave
- 162 N Decker Ave
- 163 N Streeper St
- 5 N Ellwood Ave
- 133 N Kenwood Ave
- 3018 E Fayette St
- 3039 E Baltimore St
- 28 S Potomac St
- 143 N Kenwood Ave
- 3106 E Baltimore St
- 120 N Kenwood Ave
- 2718 E Fairmount Ave
- 3111 E Baltimore St
- 29 N Curley St
- 33 N Curley St
- 27 N Curley St
- 35 N Curley St
- 25 N Curley St
- 23 N Curley St
- 39 N Curley St
- 21 N Curley St
- 21 N Curley St Unit N
- 19 N Curley St
- 28 N Potomac St
- 30 N Potomac St
- 26 N Potomac St
- 32 N Potomac St
- 24 N Potomac St
- 34 N Potomac St
- 17 N Curley St
- 22 N Potomac St
- 36 N Potomac St
- 20 N Potomac St