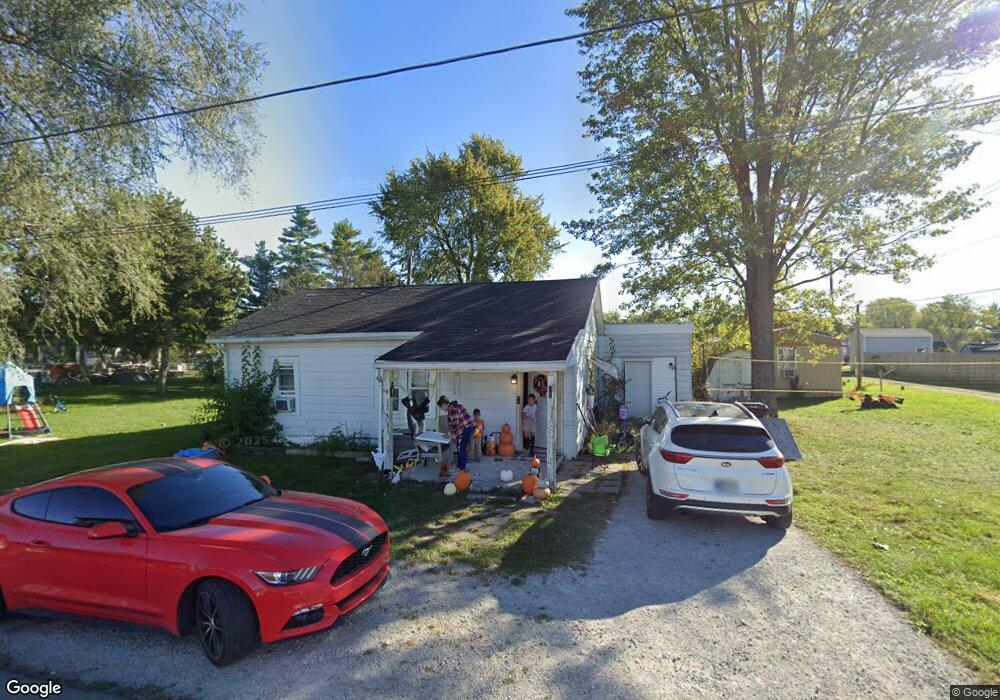
31 N Sycamore St Redkey, IN 47373
Estimated Value: $79,000 - $120,000
2
Beds
1
Bath
920
Sq Ft
$103/Sq Ft
Est. Value
About This Home
This home is located at 31 N Sycamore St, Redkey, IN 47373 and is currently estimated at $94,335, approximately $102 per square foot. 31 N Sycamore St is a home located in Jay County with nearby schools including Jay County High School.
Ownership History
Date
Name
Owned For
Owner Type
Purchase Details
Closed on
Jul 23, 2015
Sold by
Mink E
Bought by
Brown Robert L
Current Estimated Value
Create a Home Valuation Report for This Property
The Home Valuation Report is an in-depth analysis detailing your home's value as well as a comparison with similar homes in the area
Home Values in the Area
Average Home Value in this Area
Purchase History
| Date | Buyer | Sale Price | Title Company |
|---|---|---|---|
| Brown Robert L | $25,000 | Bank Of Geneva |
Source: Public Records
Tax History Compared to Growth
Tax History
| Year | Tax Paid | Tax Assessment Tax Assessment Total Assessment is a certain percentage of the fair market value that is determined by local assessors to be the total taxable value of land and additions on the property. | Land | Improvement |
|---|---|---|---|---|
| 2024 | $237 | $44,400 | $15,400 | $29,000 |
| 2023 | $524 | $62,900 | $15,400 | $47,500 |
| 2022 | $289 | $63,500 | $15,400 | $48,100 |
| 2021 | $295 | $57,000 | $15,400 | $41,600 |
| 2020 | $1,220 | $58,800 | $15,400 | $43,400 |
| 2019 | $960 | $46,200 | $15,400 | $30,800 |
| 2018 | $963 | $46,200 | $15,400 | $30,800 |
| 2017 | $955 | $45,000 | $15,400 | $29,600 |
| 2016 | $917 | $43,800 | $15,400 | $28,400 |
| 2014 | $896 | $42,900 | $15,400 | $27,500 |
| 2013 | $896 | $41,100 | $15,400 | $25,700 |
Source: Public Records
Map
Nearby Homes
- 410 W Main St
- 32 W Main St
- 800 South
- 4044 S Younkin Dr
- 104 Rick Dr
- 147 S Broad St
- 0 Auburn St Unit 202545217
- 135 S Broad St
- 347 E North St
- 234 E Commerce St
- 233 E Commerce St
- 225 E Washington St
- 129 E Washington St
- 129 E Washington St Unit Dunkirk
- 121 E Center St
- 805 Hart Dr
- 226 N Main St
- 128 W North St
- 126 W Pleasant St
- 106 N Franklin St
- 33 N Sycamore St
- 20 N Sycamore St
- 34 N Sycamore St
- 38 N Sycamore St
- 334 W Main St
- 40 N Sycamore St
- 404 W Main St
- 322 W Main St
- 20 N Ash St
- 416 W Main St
- 416 W Main St Unit Redkey
- 316 W Main St
- 43 N Sycamore St
- 16 N Ash St
- 109 N Ash St
- 422 W Main St
- 422 W Main St Unit Redkey
- 44 N Sycamore St
- 333 W Main St
- 51 N Walnut St