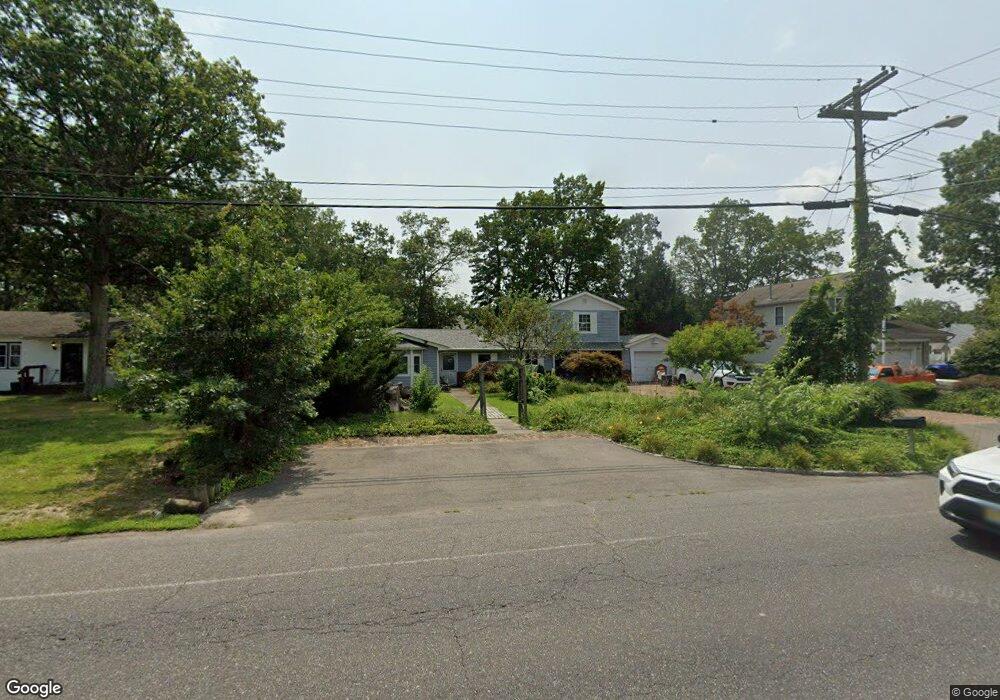
31 Nautilus Blvd Forked River, NJ 08731
Lacey Township NeighborhoodEstimated Value: $376,974 - $480,000
3
Beds
2
Baths
1,576
Sq Ft
$278/Sq Ft
Est. Value
About This Home
This home is located at 31 Nautilus Blvd, Forked River, NJ 08731 and is currently estimated at $437,494, approximately $277 per square foot. 31 Nautilus Blvd is a home located in Ocean County with nearby schools including Lacey Township High School.
Ownership History
Date
Name
Owned For
Owner Type
Purchase Details
Closed on
Apr 28, 2021
Sold by
Sleeper David P
Bought by
Sleeper David P and Sleeper Jean Lum
Current Estimated Value
Home Financials for this Owner
Home Financials are based on the most recent Mortgage that was taken out on this home.
Original Mortgage
$166,795
Interest Rate
3.09%
Mortgage Type
New Conventional
Purchase Details
Closed on
Sep 21, 2010
Sold by
Sleeper David P and Sleeper Doreen Rose
Bought by
Sleeper David P
Home Financials for this Owner
Home Financials are based on the most recent Mortgage that was taken out on this home.
Original Mortgage
$192,000
Interest Rate
4.36%
Mortgage Type
New Conventional
Purchase Details
Closed on
Mar 19, 1996
Sold by
H U D
Bought by
Russomanno Mark
Home Financials for this Owner
Home Financials are based on the most recent Mortgage that was taken out on this home.
Original Mortgage
$50,000
Interest Rate
7.89%
Mortgage Type
FHA
Create a Home Valuation Report for This Property
The Home Valuation Report is an in-depth analysis detailing your home's value as well as a comparison with similar homes in the area
Home Values in the Area
Average Home Value in this Area
Purchase History
| Date | Buyer | Sale Price | Title Company |
|---|---|---|---|
| Sleeper David P | -- | Amrock Llc | |
| Sleeper David P | -- | Amrock | |
| Sleeper David P | -- | Trans County Title Agency L | |
| Russomanno Mark | $55,000 | -- |
Source: Public Records
Mortgage History
| Date | Status | Borrower | Loan Amount |
|---|---|---|---|
| Previous Owner | Sleeper David P | $166,795 | |
| Previous Owner | Sleeper David P | $192,000 | |
| Previous Owner | Russomanno Mark | $50,000 |
Source: Public Records
Tax History Compared to Growth
Tax History
| Year | Tax Paid | Tax Assessment Tax Assessment Total Assessment is a certain percentage of the fair market value that is determined by local assessors to be the total taxable value of land and additions on the property. | Land | Improvement |
|---|---|---|---|---|
| 2025 | $5,864 | $231,400 | $107,000 | $124,400 |
| 2024 | $5,482 | $231,400 | $107,000 | $124,400 |
| 2023 | $5,237 | $231,400 | $107,000 | $124,400 |
| 2022 | $5,237 | $231,400 | $107,000 | $124,400 |
| 2021 | $5,149 | $231,400 | $107,000 | $124,400 |
| 2020 | $4,984 | $231,400 | $107,000 | $124,400 |
| 2019 | $4,896 | $231,400 | $107,000 | $124,400 |
| 2018 | $4,839 | $231,400 | $107,000 | $124,400 |
| 2017 | $4,728 | $231,400 | $107,000 | $124,400 |
| 2016 | $4,709 | $231,400 | $107,000 | $124,400 |
| 2015 | $4,498 | $231,400 | $107,000 | $124,400 |
| 2014 | $3,956 | $230,000 | $127,000 | $103,000 |
Source: Public Records
Map
Nearby Homes
- 241 Juniper Ln
- 703 Cyprus Ct
- 304 Cyprus Ct
- 207 Sunset Dr
- 111 Greenwood Ln
- 210 Sunrise Blvd
- 107 Fernwood Ln
- 308 Pine Forest Ln
- 307 Windjammer Ct
- 318 Riviera Dr
- 218 Sunset Dr
- 307 Sunrise Blvd
- 416 Irons St
- 00 Lacey Rd
- 318 Eleanor Rd
- 459 Steuben Ave
- 3 Melwen Dr
- 424 Continental St
- 22 E Lacey Rd
- 421 Carr St
- 35 Nautilus Blvd
- 27 Nautilus Blvd
- 1 Tom Gray Ct
- 37 Nautilus Blvd
- 2 Tom Gray Ct
- 25 Nautilus Blvd
- 303 Yorktown Dr
- 39 Nautilus Blvd
- 23 Nautilus Blvd
- 16 Tom Gray Ct
- 26 Nautilus Blvd
- 304 Yorktown Dr
- 3 Tom Gray Ct
- 252 Maple Ln
- 250 Maple Ln
- 4 Tom Gray Ct
- 36 Nautilus Blvd
- 19 Nautilus Blvd
- 22 Nautilus Blvd
- 43 Nautilus Blvd