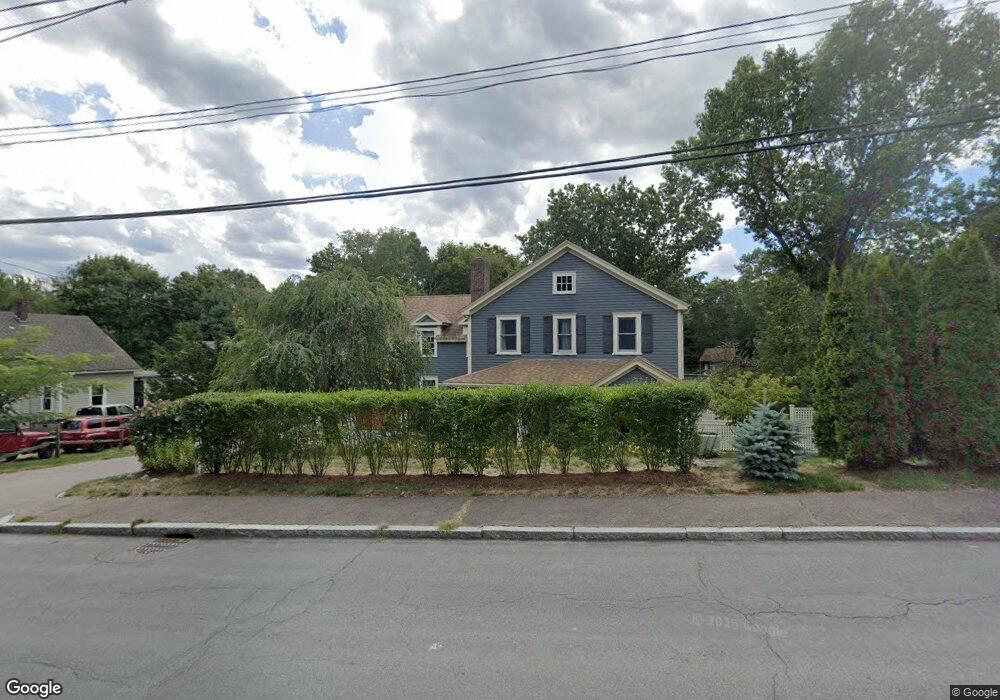
31 Newbridge St Hingham, MA 02043
Estimated Value: $1,427,000 - $1,914,000
4
Beds
3
Baths
3,680
Sq Ft
$458/Sq Ft
Est. Value
About This Home
This home is located at 31 Newbridge St, Hingham, MA 02043 and is currently estimated at $1,686,355, approximately $458 per square foot. 31 Newbridge St is a home located in Plymouth County with nearby schools including Plymouth River Elementary School, Hingham Middle School, and Hingham High School.
Ownership History
Date
Name
Owned For
Owner Type
Purchase Details
Closed on
Jan 12, 2026
Sold by
Galvin Stacey
Bought by
31 Newbridge St Rt and Galvin
Current Estimated Value
Purchase Details
Closed on
Jan 25, 2025
Sold by
Galvin Matthew D
Bought by
Galvin Stacey
Purchase Details
Closed on
May 11, 2007
Sold by
Galvin Matthew D and Galvin Stacey
Bought by
Galvin Matthew D and Galvin Stacey
Purchase Details
Closed on
May 23, 2006
Sold by
Galvin Matthew D
Bought by
Galvin Matthew D and Freda Stacey
Purchase Details
Closed on
Oct 2, 1997
Sold by
Taylor Isabel and Valorz Mary A
Bought by
Galvin Matthew D and Marella Christine M
Create a Home Valuation Report for This Property
The Home Valuation Report is an in-depth analysis detailing your home's value as well as a comparison with similar homes in the area
Purchase History
| Date | Buyer | Sale Price | Title Company |
|---|---|---|---|
| 31 Newbridge St Rt | -- | -- | |
| Galvin Stacey | -- | None Available | |
| Galvin Stacey | -- | None Available | |
| Galvin Matthew D | -- | -- | |
| Galvin Matthew D | -- | -- | |
| Galvin Matthew D | -- | -- | |
| Galvin Matthew D | -- | -- | |
| Galvin Matthew D | $189,000 | -- | |
| Galvin Matthew D | $189,000 | -- |
Source: Public Records
Mortgage History
| Date | Status | Borrower | Loan Amount |
|---|---|---|---|
| Previous Owner | Galvin Matthew D | $53,000 | |
| Previous Owner | Galvin Matthew D | $415,400 |
Source: Public Records
Tax History
| Year | Tax Paid | Tax Assessment Tax Assessment Total Assessment is a certain percentage of the fair market value that is determined by local assessors to be the total taxable value of land and additions on the property. | Land | Improvement |
|---|---|---|---|---|
| 2025 | $14,149 | $1,323,600 | $389,300 | $934,300 |
| 2024 | $13,385 | $1,233,600 | $389,300 | $844,300 |
| 2023 | $11,576 | $1,157,600 | $361,500 | $796,100 |
| 2022 | $10,910 | $943,800 | $310,000 | $633,800 |
| 2021 | $10,474 | $887,600 | $310,000 | $577,600 |
| 2020 | $0 | $887,600 | $310,000 | $577,600 |
| 2019 | $5,420 | $850,200 | $310,000 | $540,200 |
| 2018 | $0 | $850,200 | $310,000 | $540,200 |
| 2017 | $0 | $786,100 | $316,100 | $470,000 |
| 2016 | $8,734 | $699,300 | $301,300 | $398,000 |
| 2015 | $8,326 | $664,500 | $266,500 | $398,000 |
Source: Public Records
Map
Nearby Homes
- 156 Fort Hill St
- 6 Brewer Way
- 6 Adams Ct
- 7 Lewis Ct
- 24 Butler Rd
- 1799 Commercial St
- 272 North St
- 21 Hersey St
- 191 South St
- 190 South St Unit B
- 1 Squirrel Hill Ln
- 143 South St
- 12 Lafayette Ave
- 20 Woodlock Rd
- 498 Main St
- 1206 Tuckers Ln Unit 1206
- 810 Tuckers Ln
- 160 Stayner Dr
- 33 Lincoln St
- 1 Hemlock Rd
- 33 Newbridge St
- 37 Newbridge St
- 18 Newbridge St
- 38 Newbridge St
- 43 Newbridge St
- 12 Newbridge St
- 12 Newbridge St Unit 1
- 11 Newbridge St
- 7 Newbridge St
- 8 Newbridge St
- 4 Newbridge St
- 106 Fort Hill St
- 106 Fort Hill St
- 96 Fort Hill St
- 92 Fort Hill St
- 92 Fort Hill St Unit R
- 90 Fort Hill St
- 120 Fort Hill St
- 88 Fort Hill St
- 126 Fort Hill St Unit 1
Your Personal Tour Guide
Ask me questions while you tour the home.