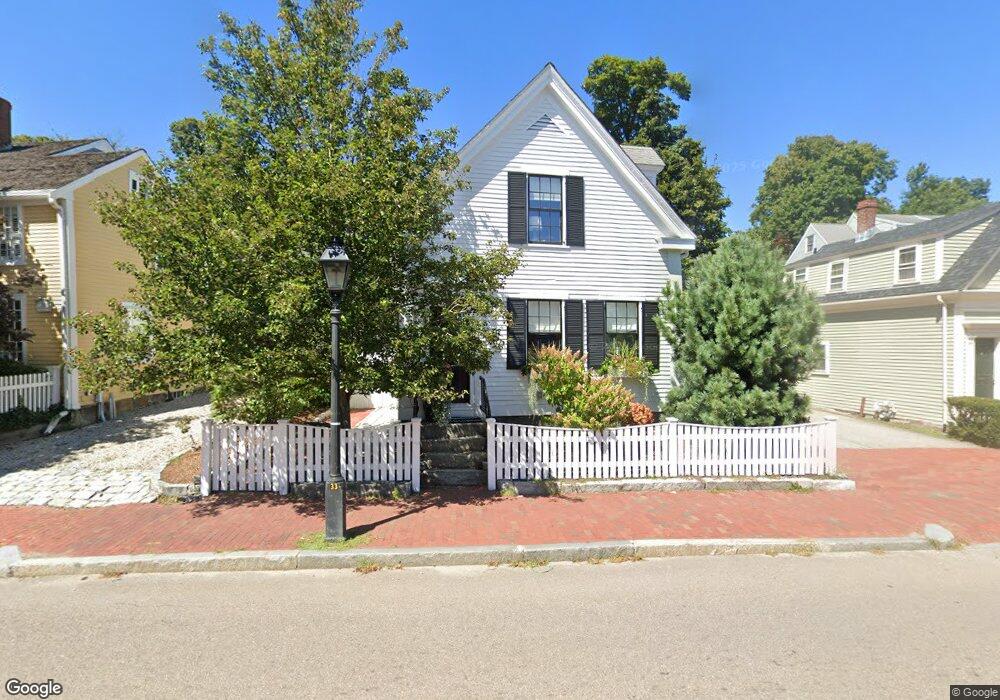
31 North St Unit 1 Hingham, MA 02043
Crow Point NeighborhoodEstimated Value: $1,087,807 - $1,344,000
3
Beds
2
Baths
1,500
Sq Ft
$830/Sq Ft
Est. Value
About This Home
This home is located at 31 North St Unit 1, Hingham, MA 02043 and is currently estimated at $1,244,702, approximately $829 per square foot. 31 North St Unit 1 is a home located in Plymouth County with nearby schools including William L. Foster Elementary School, Hingham Middle School, and Hingham High School.
Ownership History
Date
Name
Owned For
Owner Type
Purchase Details
Closed on
May 5, 2021
Sold by
Mcdermott Anthony and Mcdermott Christine
Bought by
Mcdermott Ft and Mcdermott
Current Estimated Value
Purchase Details
Closed on
Apr 27, 2018
Sold by
Granahan Terrence and Granahan Terrance E
Bought by
Mcdermott Anthony and Mcdermott Christine
Home Financials for this Owner
Home Financials are based on the most recent Mortgage that was taken out on this home.
Original Mortgage
$614,315
Interest Rate
4.44%
Mortgage Type
FHA
Purchase Details
Closed on
Jan 22, 1992
Sold by
Granahan Leon and Granahan Alice P
Bought by
Granahan Terrance
Create a Home Valuation Report for This Property
The Home Valuation Report is an in-depth analysis detailing your home's value as well as a comparison with similar homes in the area
Home Values in the Area
Average Home Value in this Area
Purchase History
We collect this data history from publicly available records. To have your information removed, we recommend requesting removal directly through your county’s website.
| Date | Buyer | Sale Price | Title Company |
|---|---|---|---|
| Mcdermott Ft | -- | None Available | |
| Mcdermott Anthony | $750,000 | -- | |
| Granahan Terrance | $120,000 | -- |
Source: Public Records
Mortgage History
We collect this data history from publicly available records. To have your information removed, we recommend requesting removal directly through your county’s website.
| Date | Status | Borrower | Loan Amount |
|---|---|---|---|
| Previous Owner | Mcdermott Anthony | $614,315 | |
| Previous Owner | Granahan Terrance | $281,122 | |
| Previous Owner | Granahan Terrance | $315,000 | |
| Previous Owner | Granahan Terrance | $161,000 |
Source: Public Records
Tax History
| Year | Tax Paid | Tax Assessment Tax Assessment Total Assessment is a certain percentage of the fair market value that is determined by local assessors to be the total taxable value of land and additions on the property. | Land | Improvement |
|---|---|---|---|---|
| 2025 | $9,944 | $930,200 | $368,400 | $561,800 |
| 2024 | $9,956 | $917,600 | $368,400 | $549,200 |
| 2023 | $8,719 | $871,900 | $368,400 | $503,500 |
| 2022 | $8,091 | $699,900 | $284,400 | $415,500 |
| 2021 | $4,162 | $683,300 | $284,400 | $398,900 |
| 2020 | $12 | $683,300 | $284,400 | $398,900 |
| 2019 | $11 | $521,600 | $284,400 | $237,200 |
| 2018 | $5,655 | $480,500 | $284,400 | $196,100 |
| 2017 | $13 | $416,300 | $266,100 | $150,200 |
| 2016 | $5,010 | $401,100 | $253,400 | $147,700 |
| 2015 | $4,794 | $382,600 | $241,300 | $141,300 |
Source: Public Records
Map
Nearby Homes
Your Personal Tour Guide
Ask me questions while you tour the home.