


Estimated payment $2,586/month
Highlights
- Craftsman Architecture
- Wood Flooring
- Loft
- Private Lot
- Main Floor Primary Bedroom
- 2 Fireplaces
About This Home
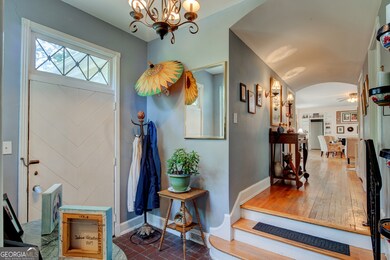
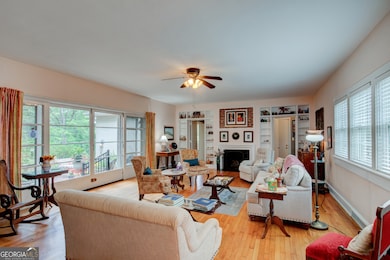
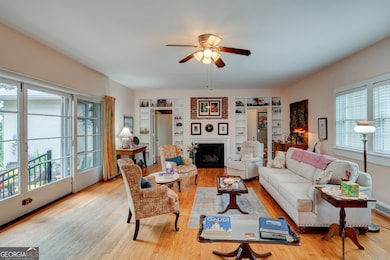
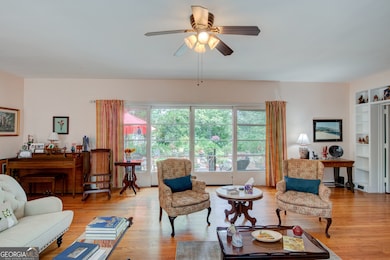
ARCHITECTURAL HISTORY MEETS MODERN COMFORT in this one-of-a-kind 1939 home designed by renowned Atlanta architect Richard Aeck and originally built for Dr. McCall. Nestled just 3 minutes from downtown Rome, this 4-bedroom, 3-bath property offers nearly 3,400 square feet of elegant, timeless living space on a private, garden-filled lot. The FOYER sets the tone with brick flooring and a dramatic curved ceiling. The MAIN LIVING ROOM is expansive, featuring a fireplace and oversized pocket doors that open to a brick patio-perfect for seamless indoor-outdoor entertaining. The DINING ROOM is a showstopper: a circular jewel of a space that opens to its own private dining patio and evokes both Hollywood Regency glamour and midcentury sophistication. The KITCHEN has been tastefully updated with Corian countertops, solid wood cabinetry, stainless steel appliances, wall ovens, a gas cooktop, built-in banquette, and dual pantries. A secondary LIVING AREA provides a more casual retreat, complete with another fireplace. The STUDY features gorgeous pickled wood paneling and a hidden wet bar, ideal for quiet evenings or stylish hosting. BEDROOMS are spacious, with a flexible floorplan that supports a variety of lifestyle needs. All three bathrooms have had updated plumbing and fixtures. OUTDOORS, the professionally designed gardens offer multiple patios, lush floral landscaping, and exceptional privacy. A GARAGE with additional storage and a covered CARPORT add convenience. The home has newer wiring, updated plumbing, a brand new HVAC system, updated windows, and natural hardwood throughout. This architect-designed classic blends historic pedigree with comfort, character, and convenience-truly a rare find in the heart of Rome.
Home Details
Home Type
- Single Family
Est. Annual Taxes
- $5,873
Year Built
- Built in 1939
Lot Details
- 0.42 Acre Lot
- Private Lot
- Corner Lot
- Sprinkler System
- Garden
Home Design
- Craftsman Architecture
- 2-Story Property
- Bungalow
- Brick Exterior Construction
- Composition Roof
Interior Spaces
- 3,388 Sq Ft Home
- Rear Stairs
- Bookcases
- High Ceiling
- 2 Fireplaces
- Entrance Foyer
- Family Room
- Den
- Library
- Loft
- Wood Flooring
- Laundry in Kitchen
Kitchen
- Built-In Oven
- Cooktop
- Dishwasher
- Stainless Steel Appliances
Bedrooms and Bathrooms
- 4 Bedrooms | 3 Main Level Bedrooms
- Primary Bedroom on Main
- Bathtub Includes Tile Surround
- Separate Shower
Basement
- Partial Basement
- Interior Basement Entry
Parking
- Garage
- Carport
- Parking Accessed On Kitchen Level
- Garage Door Opener
Location
- Property is near shops
Schools
- East Central Elementary School
- Rome Middle School
- Rome High School
Utilities
- Central Heating and Cooling System
- Heating System Uses Natural Gas
- High Speed Internet
- Phone Available
- Cable TV Available
Community Details
- No Home Owners Association
- Old East Rome Subdivision
Map
Home Values in the Area
Average Home Value in this Area
Tax History
| Year | Tax Paid | Tax Assessment Tax Assessment Total Assessment is a certain percentage of the fair market value that is determined by local assessors to be the total taxable value of land and additions on the property. | Land | Improvement |
|---|---|---|---|---|
| 2024 | $4,346 | $165,841 | $17,769 | $148,072 |
| 2023 | $4,308 | $139,526 | $16,154 | $123,372 |
| 2022 | $4,146 | $148,865 | $13,327 | $135,538 |
| 2021 | $4,008 | $136,923 | $13,327 | $123,596 |
| 2020 | $3,901 | $128,728 | $10,096 | $118,632 |
| 2019 | $3,762 | $123,398 | $10,096 | $113,302 |
| 2018 | $3,618 | $117,867 | $10,096 | $107,771 |
| 2017 | $3,454 | $113,437 | $10,096 | $103,341 |
| 2016 | $3,412 | $111,958 | $10,080 | $101,878 |
| 2015 | $3,882 | $111,958 | $10,080 | $101,878 |
| 2014 | $3,882 | $111,958 | $10,080 | $101,878 |
Property History
| Date | Event | Price | List to Sale | Price per Sq Ft |
|---|---|---|---|---|
| 10/09/2025 10/09/25 | Price Changed | $399,000 | -9.1% | $118 / Sq Ft |
| 08/04/2025 08/04/25 | Price Changed | $439,000 | -4.6% | $130 / Sq Ft |
| 06/27/2025 06/27/25 | For Sale | $460,000 | -- | $136 / Sq Ft |
Purchase History
| Date | Type | Sale Price | Title Company |
|---|---|---|---|
| Warranty Deed | -- | -- | |
| Deed | $308,000 | -- | |
| Quit Claim Deed | -- | -- | |
| Quit Claim Deed | -- | -- | |
| Warranty Deed | $100,000 | -- | |
| Deed | -- | -- | |
| Warranty Deed | $100,000 | -- | |
| Warranty Deed | -- | -- | |
| Deed | -- | -- |
Mortgage History
| Date | Status | Loan Amount | Loan Type |
|---|---|---|---|
| Previous Owner | $245,000 | New Conventional |
Source: Georgia MLS
MLS Number: 10552742
APN: J14J-020
Disclaimer: Certain information contained herein is derived from information provided by parties other than Homes.com. All information provided is deemed reliable, but is not guaranteed to be accurate and should be independently verified.
![]() The data relating to real estate for sale on this web site comes in part from the Broker Reciprocity Program of Georgia MLS. Real estate listings held by brokerage firms other than Redfin are marked with the Broker Reciprocity logo and detailed information about them includes the name of the listing brokers. Information deemed reliable but not guaranteed. Copyright 2025 Georgia MLS. All rights reserved.
The data relating to real estate for sale on this web site comes in part from the Broker Reciprocity Program of Georgia MLS. Real estate listings held by brokerage firms other than Redfin are marked with the Broker Reciprocity logo and detailed information about them includes the name of the listing brokers. Information deemed reliable but not guaranteed. Copyright 2025 Georgia MLS. All rights reserved.
- 9 Eastridge Ct SW
- 170 E 11th St SW
- 162 E 11th St SE
- 168 E 11th St SE
- 164 E 11th St SE
- 166 E 11th St SW
- 525 E 14th St SW
- 2 E 10th St SW
- 415 E 10th St SE
- 1011 Walnut Ave SW
- 801 Maple Ave SW
- 4 E 15th St SW
- 1314 E 2nd Ave SE
- 2 Fair St SW
- 13 Townview Rd SE
- 0 Turnbull Dr SE Unit 10570009
- 39 E 16th St SW
- 2 Coral Ave SW
- 414 E 17th St SW
- 1 Vassar Dr SE
- 812 Darlington Way SW
- 707 E 2nd Ave
- 3 Fair St SW Unit A
- 2522 Callier Springs Rd SE
- 12 Morningside Dr SW
- 413 E 2nd St
- 114 Broad St Unit 208
- 35 Vocational Dr SW
- 507 E 2nd St Unit 3
- 7 Myrtle St SW
- 116 Holly St SE
- 121 Chateau Dr SE
- 340 W 3rd St SW
- 40 Chateau Dr SE
- 48 Chateau Dr SE
- 50 Chateau Dr SE
- 712 Avenue A NE
- 3113 Village Blvd SE
- 2 Cliffview Dr SE Unit 5
- 2 Cliffview Dr SE Unit 6
