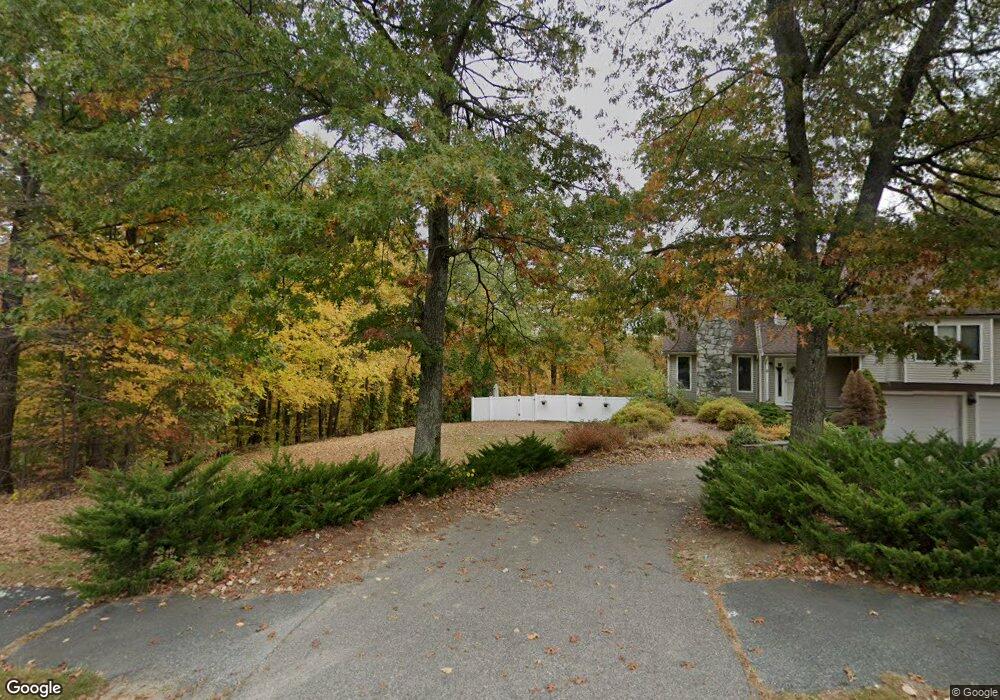
31 Old Southbridge Rd Oxford, MA 01540
Estimated Value: $638,070 - $778,000
4
Beds
3
Baths
2,356
Sq Ft
$293/Sq Ft
Est. Value
About This Home
This home is located at 31 Old Southbridge Rd, Oxford, MA 01540 and is currently estimated at $689,518, approximately $292 per square foot. 31 Old Southbridge Rd is a home located in Worcester County with nearby schools including Alfred M Chaffee, Oxford High School, and Clara Barton Elementary School.
Ownership History
Date
Name
Owned For
Owner Type
Purchase Details
Closed on
Jul 26, 2005
Sold by
Double L Rlty Inc
Bought by
Miller Kenneth E
Current Estimated Value
Home Financials for this Owner
Home Financials are based on the most recent Mortgage that was taken out on this home.
Original Mortgage
$125,000
Outstanding Balance
$65,368
Interest Rate
5.59%
Mortgage Type
Purchase Money Mortgage
Estimated Equity
$624,150
Create a Home Valuation Report for This Property
The Home Valuation Report is an in-depth analysis detailing your home's value as well as a comparison with similar homes in the area
Home Values in the Area
Average Home Value in this Area
Purchase History
| Date | Buyer | Sale Price | Title Company |
|---|---|---|---|
| Miller Kenneth E | $427,670 | -- |
Source: Public Records
Mortgage History
| Date | Status | Borrower | Loan Amount |
|---|---|---|---|
| Open | Miller Kenneth E | $125,000 |
Source: Public Records
Tax History Compared to Growth
Tax History
| Year | Tax Paid | Tax Assessment Tax Assessment Total Assessment is a certain percentage of the fair market value that is determined by local assessors to be the total taxable value of land and additions on the property. | Land | Improvement |
|---|---|---|---|---|
| 2025 | $72 | $564,800 | $139,000 | $425,800 |
| 2024 | $7,047 | $522,800 | $132,800 | $390,000 |
| 2023 | $6,536 | $479,200 | $127,100 | $352,100 |
| 2022 | $6,446 | $398,900 | $103,600 | $295,300 |
| 2021 | $6,232 | $377,000 | $99,300 | $277,700 |
| 2020 | $6,023 | $361,500 | $99,300 | $262,200 |
| 2019 | $5,542 | $325,400 | $92,100 | $233,300 |
| 2018 | $5,283 | $305,900 | $92,100 | $213,800 |
| 2017 | $5,215 | $309,500 | $88,300 | $221,200 |
| 2016 | $5,240 | $309,500 | $88,300 | $221,200 |
| 2015 | $4,887 | $309,500 | $88,300 | $221,200 |
| 2014 | $4,757 | $317,100 | $86,100 | $231,000 |
Source: Public Records
Map
Nearby Homes
- 11 Sullivan Blvd
- 7 Sullivan Blvd
- 9 Sullivan Blvd
- 15 Sullivan Blvd
- 5 Sullivan Blvd
- 8 Sullivan Blvd
- 17 Sullivan Blvd
- 10 Sullivan Blvd
- 6 Sullivan Blvd
- 29 Old Southbridge Rd
- 27 Old Southbridge Rd
- 4 Sullivan Blvd
- 12 Sullivan Blvd
- 35 Old Southbridge Rd
- 19 Sullivan Blvd
- 33 Old Southbridge Rd
- 2 Sullivan Blvd
- 21 Sullivan Blvd
- 26 Old Southbridge Rd
- 24 Old Southbridge Rd