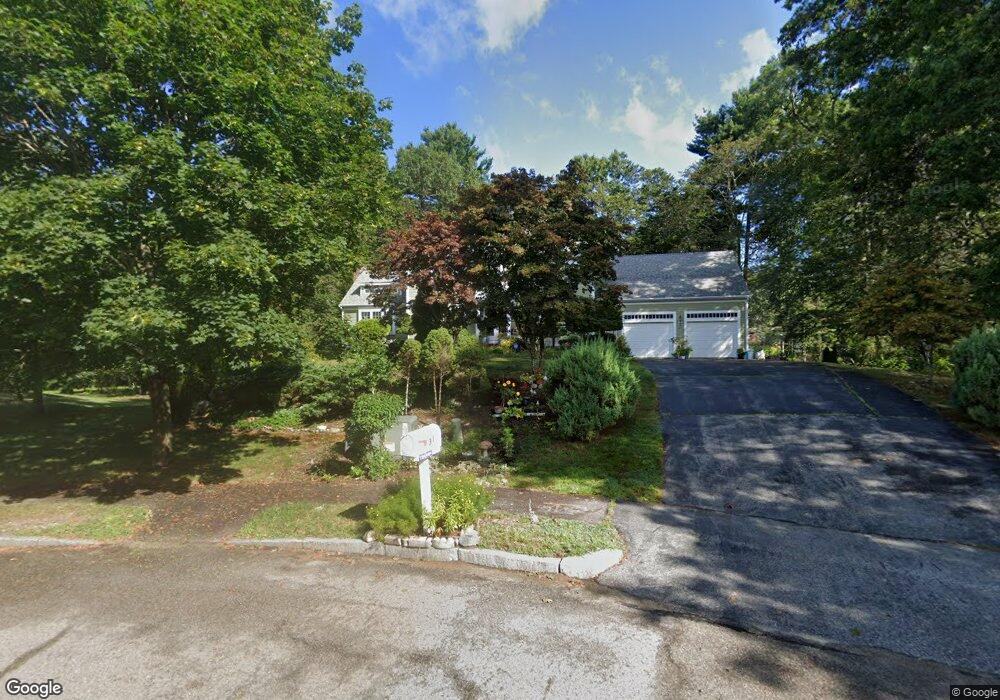
31 Osprey Ln Hanover, MA 02339
Estimated Value: $919,000 - $1,080,000
4
Beds
3
Baths
2,204
Sq Ft
$440/Sq Ft
Est. Value
About This Home
This home is located at 31 Osprey Ln, Hanover, MA 02339 and is currently estimated at $970,111, approximately $440 per square foot. 31 Osprey Ln is a home located in Plymouth County with nearby schools including Hanover High School and Calvary Chapel Academy.
Ownership History
Date
Name
Owned For
Owner Type
Purchase Details
Closed on
Jul 3, 2014
Sold by
Dao Trung D and Dao Cuc P
Bought by
Dao Ft and Dao
Current Estimated Value
Purchase Details
Closed on
Oct 21, 2002
Sold by
Bober Rt and Bober
Bought by
Dao Cuc Pham and Dao Trung
Home Financials for this Owner
Home Financials are based on the most recent Mortgage that was taken out on this home.
Original Mortgage
$200,000
Interest Rate
6.18%
Mortgage Type
Purchase Money Mortgage
Create a Home Valuation Report for This Property
The Home Valuation Report is an in-depth analysis detailing your home's value as well as a comparison with similar homes in the area
Home Values in the Area
Average Home Value in this Area
Purchase History
| Date | Buyer | Sale Price | Title Company |
|---|---|---|---|
| Dao Ft | -- | -- | |
| Dao Ft | -- | -- | |
| Dao Cuc Pham | $510,950 | -- | |
| Dao Cuc Pham | $510,950 | -- |
Source: Public Records
Mortgage History
| Date | Status | Borrower | Loan Amount |
|---|---|---|---|
| Previous Owner | Dao Cuc Pham | $160,000 | |
| Previous Owner | Dao Cuc Pham | $200,000 |
Source: Public Records
Tax History Compared to Growth
Tax History
| Year | Tax Paid | Tax Assessment Tax Assessment Total Assessment is a certain percentage of the fair market value that is determined by local assessors to be the total taxable value of land and additions on the property. | Land | Improvement |
|---|---|---|---|---|
| 2025 | $11,216 | $908,200 | $324,500 | $583,700 |
| 2024 | $10,931 | $851,300 | $324,500 | $526,800 |
| 2023 | $10,289 | $762,700 | $295,000 | $467,700 |
| 2022 | $10,012 | $656,500 | $245,800 | $410,700 |
| 2021 | $5,588 | $610,500 | $223,400 | $387,100 |
| 2020 | $9,673 | $593,100 | $223,400 | $369,700 |
| 2019 | $5,391 | $568,800 | $223,400 | $345,400 |
| 2018 | $8,695 | $534,100 | $223,400 | $310,700 |
| 2017 | $8,683 | $542,300 | $233,100 | $309,200 |
| 2016 | $8,668 | $514,100 | $212,000 | $302,100 |
| 2015 | $8,614 | $533,400 | $231,300 | $302,100 |
Source: Public Records
Map
Nearby Homes
- 75 School St
- 561 Circuit St
- 95 Tecumseh Dr
- 696 Summer St
- 107 Manzella Ct
- 810 Brookline Way
- 108 Waterford Dr
- 36 Grove St
- 17 Pat Rose Way
- 8 Pat Rose Way
- 6 Pat Rose Way
- 9 Pat Rose Way
- 51 Cervelli Farm Dr
- 37 Dr
- 23 Cervelli Farm Dr
- 38 Cervelli Farm Dr
- 9 Cervelli Farm Dr
- 14 Birch Bottom Cir
- 5 Alpine St
- 13 Hayford Trail Unit 15