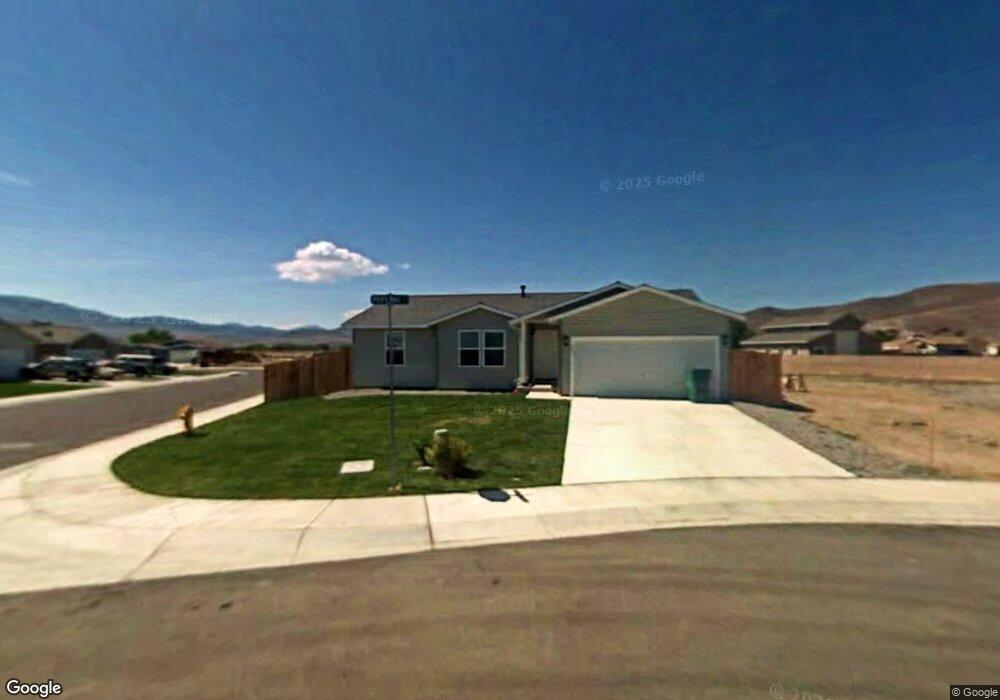
31 Pepling Ct Dayton, NV 89403
Estimated Value: $407,154 - $454,000
3
Beds
2
Baths
1,536
Sq Ft
$275/Sq Ft
Est. Value
About This Home
This home is located at 31 Pepling Ct, Dayton, NV 89403 and is currently estimated at $422,789, approximately $275 per square foot. 31 Pepling Ct is a home located in Lyon County with nearby schools including Sutro Elementary School, Dayton Intermediate School, and Dayton High School.
Ownership History
Date
Name
Owned For
Owner Type
Purchase Details
Closed on
Apr 20, 2023
Sold by
Shadden Julia
Bought by
Endress Julia A Shadden
Current Estimated Value
Home Financials for this Owner
Home Financials are based on the most recent Mortgage that was taken out on this home.
Original Mortgage
$132,407
Outstanding Balance
$129,531
Interest Rate
6.73%
Mortgage Type
New Conventional
Estimated Equity
$293,258
Purchase Details
Closed on
Sep 17, 2018
Sold by
Endress Dov and Endress Julia Shadden
Bought by
Shadden Julia
Purchase Details
Closed on
Oct 21, 2016
Sold by
Shadden Endress Julia and Shadden Julia A
Bought by
Endress Dov and Shadden Endress Julia
Purchase Details
Closed on
Oct 23, 2007
Sold by
Citizens For Affordable Homes Inc
Bought by
Shadden Julia A
Home Financials for this Owner
Home Financials are based on the most recent Mortgage that was taken out on this home.
Original Mortgage
$138,285
Interest Rate
6.35%
Create a Home Valuation Report for This Property
The Home Valuation Report is an in-depth analysis detailing your home's value as well as a comparison with similar homes in the area
Home Values in the Area
Average Home Value in this Area
Purchase History
| Date | Buyer | Sale Price | Title Company |
|---|---|---|---|
| Endress Julia A Shadden | -- | Stewart Title Company | |
| Shadden Julia | $8,000 | None Available | |
| Endress Dov | -- | None Available | |
| Shadden Julia A | $80,000 | Western Title Company |
Source: Public Records
Mortgage History
| Date | Status | Borrower | Loan Amount |
|---|---|---|---|
| Open | Endress Julia A Shadden | $132,407 | |
| Previous Owner | Shadden Julia A | $138,285 |
Source: Public Records
Tax History
| Year | Tax Paid | Tax Assessment Tax Assessment Total Assessment is a certain percentage of the fair market value that is determined by local assessors to be the total taxable value of land and additions on the property. | Land | Improvement |
|---|---|---|---|---|
| 2025 | $1,508 | $92,537 | $33,950 | $58,587 |
| 2024 | $1,464 | $89,564 | $30,800 | $58,763 |
| 2023 | $1,464 | $83,697 | $28,700 | $54,997 |
| 2022 | $1,194 | $76,278 | $25,200 | $51,078 |
| 2021 | $1,159 | $74,895 | $25,200 | $49,695 |
| 2020 | $1,124 | $72,264 | $25,200 | $47,064 |
| 2019 | $1,092 | $70,636 | $25,200 | $45,436 |
| 2018 | $1,060 | $65,188 | $21,000 | $44,188 |
| 2017 | $1,029 | $54,617 | $10,500 | $44,117 |
| 2016 | $1,003 | $40,640 | $5,250 | $35,390 |
| 2015 | $1,001 | $33,950 | $5,250 | $28,700 |
| 2014 | $972 | $30,432 | $6,300 | $24,132 |
Source: Public Records
Map
Nearby Homes
- 235 Glen Vista Dr
- 233 Misty Way
- 738 Butte Creek Rd
- 836 Antelope Springs Dr Unit Lot 28
- 305 Mountain Spring Ct
- 357 Halite Dr
- 359 Halite Dr
- 40 Flowery Ave
- 244 Green Ln
- 246 Green Ln
- 343 Halite Dr
- 345 Halite Dr
- 258 Green Ln
- 260 Green Ln
- 5 River Rd
- 305a Grosh Ave
- 101 Southend Dr
- 490 Sheep Camp Rd Unit Homesite 119
- 486 Sheep Camp Rd Unit Homesite 121
- 484 Sheep Camp Rd Unit Homesite 122
- 21 Pepling Ct
- 101 Kramer Way
- 106 Kramer Way
- 104 Kramer Way
- 11 Pepling Ct
- 102 Kramer Way
- 100 Kramer Way
- 30 Pepling Ct
- 20 Pepling Ct
- 110 Kramer Way
- 209 Glen Vista Dr
- 207 Glen Vista Dr
- 205 Glen Vista Dr
- 100 Stonefield Ln
- 11 Jasper Ln
- 100 Pine Cone Rd
- 211 Glen Vista Dr
- 103 Stonefield Ln
- 31 Gulch Ct
- 21 Gulch Ct
Your Personal Tour Guide
Ask me questions while you tour the home.