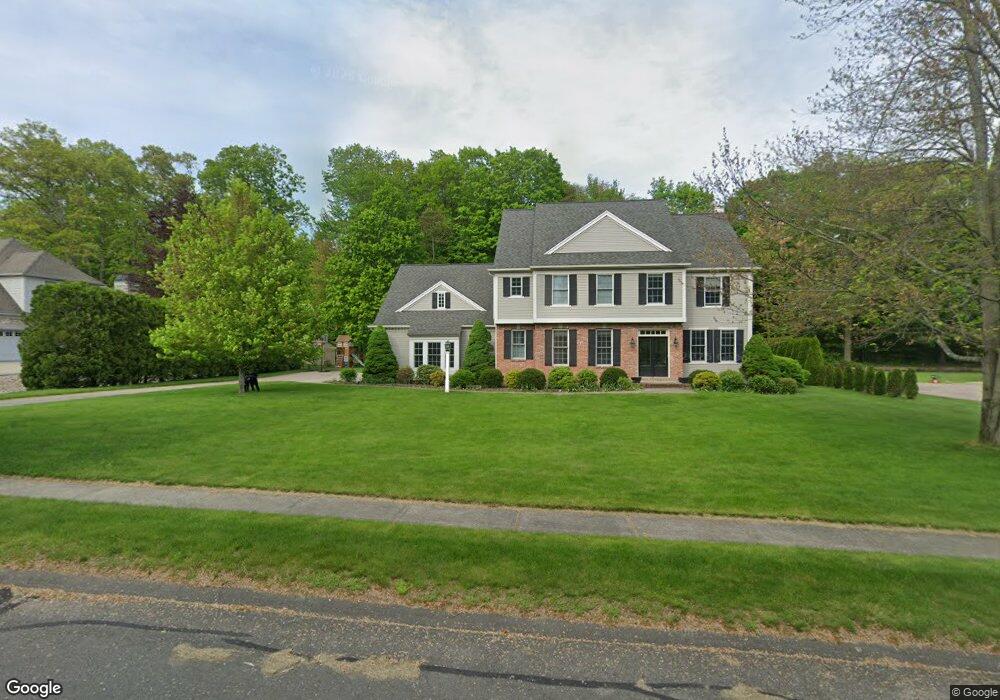
31 Pheasants Crossing West Springfield, MA 01089
Estimated Value: $624,363 - $695,000
3
Beds
3
Baths
2,526
Sq Ft
$257/Sq Ft
Est. Value
About This Home
This home is located at 31 Pheasants Crossing, West Springfield, MA 01089 and is currently estimated at $649,591, approximately $257 per square foot. 31 Pheasants Crossing is a home located in Hampden County with nearby schools including West Springfield High School, Hampden Charter School of Science West, and St Thomas The Apostle School.
Ownership History
Date
Name
Owned For
Owner Type
Purchase Details
Closed on
Mar 20, 2012
Sold by
Leone Jared B and Leone Nicole
Bought by
Leone Jared B and Leone Nicole
Current Estimated Value
Home Financials for this Owner
Home Financials are based on the most recent Mortgage that was taken out on this home.
Original Mortgage
$344,000
Outstanding Balance
$236,191
Interest Rate
3.86%
Mortgage Type
New Conventional
Estimated Equity
$413,400
Purchase Details
Closed on
Jul 15, 2011
Sold by
Brothers William K and Brothers Marcia
Bought by
Leone Jared B and Bongiovanni Nicole
Home Financials for this Owner
Home Financials are based on the most recent Mortgage that was taken out on this home.
Original Mortgage
$345,000
Interest Rate
4.58%
Mortgage Type
Purchase Money Mortgage
Purchase Details
Closed on
Nov 13, 2001
Sold by
Lucier Ft and Lucier Rene
Bought by
Brothers William K and Brothers Marcia
Purchase Details
Closed on
Oct 4, 2001
Sold by
Lucier Ft and Lucier Rene
Bought by
Brothers William K and Brothers Marcia
Create a Home Valuation Report for This Property
The Home Valuation Report is an in-depth analysis detailing your home's value as well as a comparison with similar homes in the area
Home Values in the Area
Average Home Value in this Area
Purchase History
| Date | Buyer | Sale Price | Title Company |
|---|---|---|---|
| Leone Jared B | -- | -- | |
| Leone Jared B | $395,000 | -- | |
| Brothers William K | $337,800 | -- | |
| Brothers William K | $337,800 | -- |
Source: Public Records
Mortgage History
| Date | Status | Borrower | Loan Amount |
|---|---|---|---|
| Open | Leone Jared B | $344,000 | |
| Previous Owner | Leone Jared B | $345,000 | |
| Previous Owner | Brothers William K | $330,000 | |
| Previous Owner | Brothers William K | $160,000 |
Source: Public Records
Tax History Compared to Growth
Tax History
| Year | Tax Paid | Tax Assessment Tax Assessment Total Assessment is a certain percentage of the fair market value that is determined by local assessors to be the total taxable value of land and additions on the property. | Land | Improvement |
|---|---|---|---|---|
| 2025 | $8,363 | $562,400 | $131,500 | $430,900 |
| 2024 | $7,673 | $518,100 | $137,400 | $380,700 |
| 2023 | $7,660 | $492,900 | $154,500 | $338,400 |
| 2022 | $7,171 | $455,000 | $140,200 | $314,800 |
| 2021 | $6,924 | $409,700 | $147,200 | $262,500 |
| 2020 | $6,947 | $408,900 | $147,200 | $261,700 |
| 2019 | $6,935 | $408,900 | $147,200 | $261,700 |
| 2018 | $6,972 | $408,900 | $147,200 | $261,700 |
| 2017 | $6,972 | $408,900 | $147,200 | $261,700 |
| 2016 | $7,279 | $428,400 | $158,500 | $269,900 |
| 2015 | $7,137 | $420,100 | $155,500 | $264,600 |
| 2014 | $1,737 | $420,100 | $155,500 | $264,600 |
Source: Public Records
Map
Nearby Homes
- 89 Vincent Dr
- 75 Birnie Ave
- 86 Birnie Ave
- 43 Wishing Well Way
- 34 High Meadow Dr
- 236 Forest Glen
- Lot 3 Hyde Rd
- 36 Shady Brook
- 64 Apple Ridge Rd
- 81 Laurence Dr
- 32 Windpath E
- 147 Grandview Ave
- 65 Verdugo St
- 16 North St
- 59 Beech Hill Rd
- 260 Wolcott Ave
- 42 Janet St
- 43 Greenleaf Ave
- 26 Clayton Dr
- 9 Annie's Way
- 45 Pheasants Crossing
- 19 Pheasants Crossing
- 61 Pheasants Crossing
- 138 Pease Ave
- 52 Pheasants Crossing
- 118 Pease Ave
- 174 Pease Ave
- 154 Pease Ave
- 64 Pheasants Crossing
- 71 Pheasants Crossing
- 106 Pease Ave
- 76 Pheasants Crossing
- 131 Pease Ave
- 145 Pease Ave
- 119 Pease Ave
- 88 Pease Ave
- 89 Pheasants Crossing
- Parcel C Amostown Rd
- 0 End of Stone Path Ln Unit 70495758
- 6 Abigaile Ln Unit L