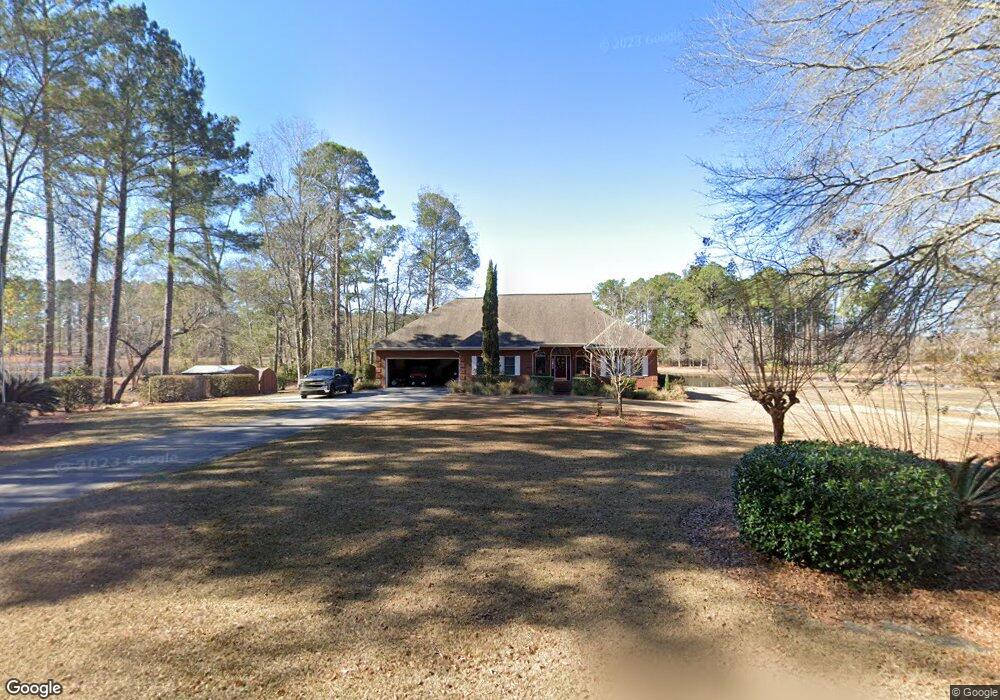
31 Pine Lake Rd Tifton, GA 31793
Estimated Value: $326,000 - $412,000
3
Beds
3
Baths
2,363
Sq Ft
$153/Sq Ft
Est. Value
About This Home
This home is located at 31 Pine Lake Rd, Tifton, GA 31793 and is currently estimated at $361,995, approximately $153 per square foot. 31 Pine Lake Rd is a home located in Tift County with nearby schools including Len Lastinger Primary School, Matt Wilson Elementary School, and J.T. Reddick School.
Ownership History
Date
Name
Owned For
Owner Type
Purchase Details
Closed on
Dec 19, 2011
Sold by
Federal Home Loan Mortgage Corporation
Bought by
Folsom Wayne and Folsom Lori S
Current Estimated Value
Purchase Details
Closed on
Oct 4, 2011
Sold by
Us Bank National Association
Bought by
Federal Home Loan Mortgage Corporation
Purchase Details
Closed on
Oct 17, 2005
Sold by
Merritt Mary Sue
Bought by
Hilton Leola T
Home Financials for this Owner
Home Financials are based on the most recent Mortgage that was taken out on this home.
Original Mortgage
$256,000
Interest Rate
5.71%
Mortgage Type
New Conventional
Purchase Details
Closed on
Jun 18, 1998
Sold by
Evans John Dell and Evans Theresa
Bought by
Merritt Mary Sue
Purchase Details
Closed on
Nov 12, 1986
Sold by
Jones Carroll Applewit
Bought by
Evans John Dell and Evans Theresa
Create a Home Valuation Report for This Property
The Home Valuation Report is an in-depth analysis detailing your home's value as well as a comparison with similar homes in the area
Home Values in the Area
Average Home Value in this Area
Purchase History
| Date | Buyer | Sale Price | Title Company |
|---|---|---|---|
| Folsom Wayne | $189,900 | -- | |
| Federal Home Loan Mortgage Corporation | $190,800 | -- | |
| Us Bank National Association | $190,800 | -- | |
| Hilton Leola T | $260,000 | -- | |
| Merritt Mary Sue | $23,500 | -- | |
| Evans John Dell | $17,500 | -- |
Source: Public Records
Mortgage History
| Date | Status | Borrower | Loan Amount |
|---|---|---|---|
| Previous Owner | Hilton Leola T | $256,000 |
Source: Public Records
Tax History Compared to Growth
Tax History
| Year | Tax Paid | Tax Assessment Tax Assessment Total Assessment is a certain percentage of the fair market value that is determined by local assessors to be the total taxable value of land and additions on the property. | Land | Improvement |
|---|---|---|---|---|
| 2024 | $3,371 | $144,212 | $12,140 | $132,072 |
| 2023 | $3,371 | $99,244 | $8,280 | $90,964 |
| 2022 | $2,878 | $98,949 | $8,280 | $90,669 |
| 2021 | $2,895 | $98,949 | $8,280 | $90,669 |
| 2020 | $2,950 | $98,949 | $8,280 | $90,669 |
| 2019 | $2,944 | $98,949 | $8,280 | $90,669 |
| 2018 | $2,940 | $98,949 | $8,280 | $90,669 |
| 2017 | $2,953 | $98,949 | $8,280 | $90,669 |
| 2016 | $2,956 | $98,949 | $8,280 | $90,669 |
| 2015 | $2,957 | $98,949 | $8,280 | $90,669 |
| 2014 | $2,963 | $98,949 | $8,280 | $90,669 |
| 2013 | -- | $98,948 | $8,280 | $90,668 |
Source: Public Records
Map
Nearby Homes
- W Hutchinson Rd
- 0 Carpenter Rd N
- 0 W Hutchinson Rd
- 639 Zion Hope Rd
- 31 Henry Way
- 26 Alan Ln
- 7 Deborah Dr
- Tract 2 Whiddon Mill Rd
- Tract 1 Whiddon Mill Rd
- 50 Margaret Ln
- 100 Elizabeth Dr
- 1808 Rutland Rd
- 0 US Highway 41 Unit 137727
- 1607 Mallard Ln
- 4620 Murray Ave
- 0 N U S Hwy 41
- 78 Chase Cir
- 2609 Emmett Dr
- 1901 Melba Dr
- 7006 Northgate Dr
- 21 Pinelake Rd
- 63 Pine Lake Rd
- 63 Pine Lake Rd
- 69 Pine Lake Rd
- 350 Zion Hope Rd
- 320 Zion Hope Rd
- 81 Pine Lake Rd
- 313 Zion Hope Rd
- 321 Zion Hope Rd
- 372 Zion Hope Rd
- 353 Zion Hope Rd
- 373 Zion Hope Rd
- 99 Pine Lake Rd
- 285 Zion Hope Rd
- 219 Hutchinson Rd
- 237 Hutchinson Rd
- 385 Zion Hope Rd
- 359 Carpenter Rd N
- 233 Hutchinson Rd
- 400 Zion Hope Rd