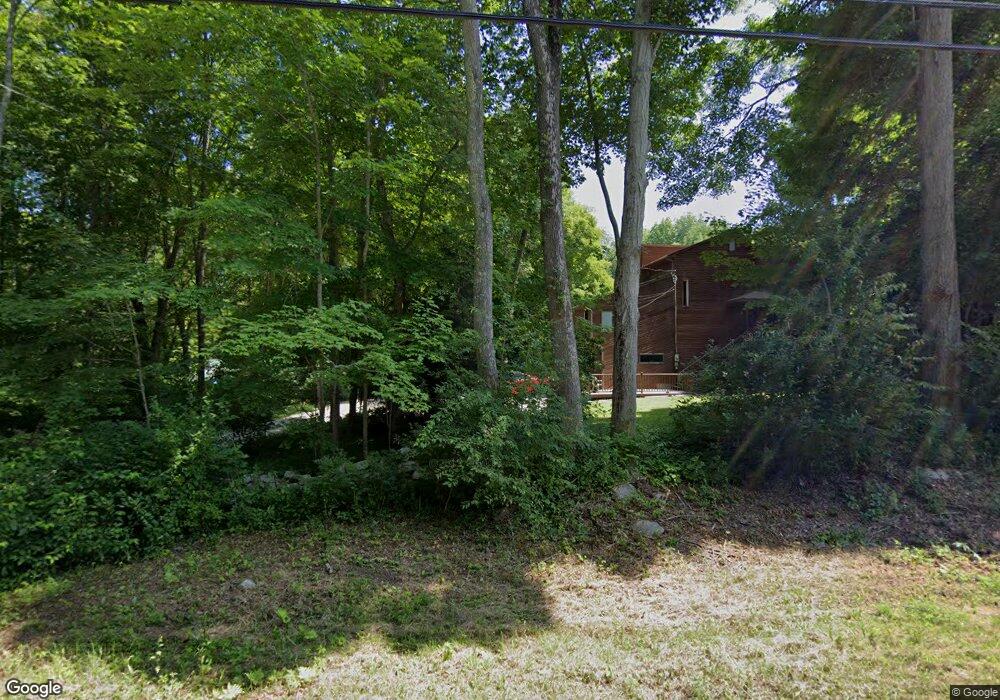
31 Pine St Columbia, CT 06237
Estimated Value: $249,000 - $576,000
4
Beds
3
Baths
2,904
Sq Ft
$149/Sq Ft
Est. Value
About This Home
This home is located at 31 Pine St, Columbia, CT 06237 and is currently estimated at $432,022, approximately $148 per square foot. 31 Pine St is a home located in Tolland County with nearby schools including Horace W. Porter School.
Ownership History
Date
Name
Owned For
Owner Type
Purchase Details
Closed on
Mar 7, 2013
Sold by
Moon Brendan and Moon Bianca
Bought by
Ryan Thomas M
Current Estimated Value
Home Financials for this Owner
Home Financials are based on the most recent Mortgage that was taken out on this home.
Original Mortgage
$230,000
Interest Rate
3.56%
Mortgage Type
Stand Alone Refi Refinance Of Original Loan
Purchase Details
Closed on
Feb 24, 1984
Bought by
Ryan Thomas and Ryan Janice
Create a Home Valuation Report for This Property
The Home Valuation Report is an in-depth analysis detailing your home's value as well as a comparison with similar homes in the area
Home Values in the Area
Average Home Value in this Area
Purchase History
| Date | Buyer | Sale Price | Title Company |
|---|---|---|---|
| Ryan Thomas M | $82,000 | -- | |
| Ryan Thomas | -- | -- |
Source: Public Records
Mortgage History
| Date | Status | Borrower | Loan Amount |
|---|---|---|---|
| Open | Ryan Thomas | $305,000 | |
| Closed | Ryan Thomas | $275,000 | |
| Closed | Ryan Thomas | $230,000 |
Source: Public Records
Tax History Compared to Growth
Tax History
| Year | Tax Paid | Tax Assessment Tax Assessment Total Assessment is a certain percentage of the fair market value that is determined by local assessors to be the total taxable value of land and additions on the property. | Land | Improvement |
|---|---|---|---|---|
| 2025 | $7,388 | $252,420 | $50,260 | $202,160 |
| 2024 | $7,098 | $252,420 | $50,260 | $202,160 |
| 2023 | $6,540 | $252,420 | $50,260 | $202,160 |
| 2022 | $6,530 | $252,420 | $50,260 | $202,160 |
| 2021 | $6,843 | $233,300 | $47,100 | $186,200 |
| 2020 | $6,843 | $233,300 | $47,100 | $186,200 |
| 2019 | $6,843 | $233,300 | $47,100 | $186,200 |
| 2018 | $6,843 | $233,300 | $47,100 | $186,200 |
| 2017 | $6,738 | $233,300 | $47,100 | $186,200 |
| 2016 | $6,448 | $235,000 | $47,100 | $187,900 |
| 2015 | $6,376 | $235,000 | $47,100 | $187,900 |
| 2014 | $6,376 | $235,000 | $47,100 | $187,900 |
Source: Public Records
Map
Nearby Homes
- 78 Hennequin Rd
- 9 Doubleday Rd
- 2 Summit Rd
- 10 Lakeview Park
- 0 Chowanec Rd
- 00 Zola Rd
- 65 Trumbull Hwy
- 35 Basket Shop Rd
- 65 Wellswood Rd
- 80 Wellswood Rd Unit 17
- 64 Loveland Rd
- 249 Wall St
- 105 Lake Shore Dr
- 146 Lake Shore Dr
- 811 Pucker St
- 111 Bascom Rd
- 161 Lake Williams Dr
- 1 Church St
- 2 Church St
- 22 Grandview Dr