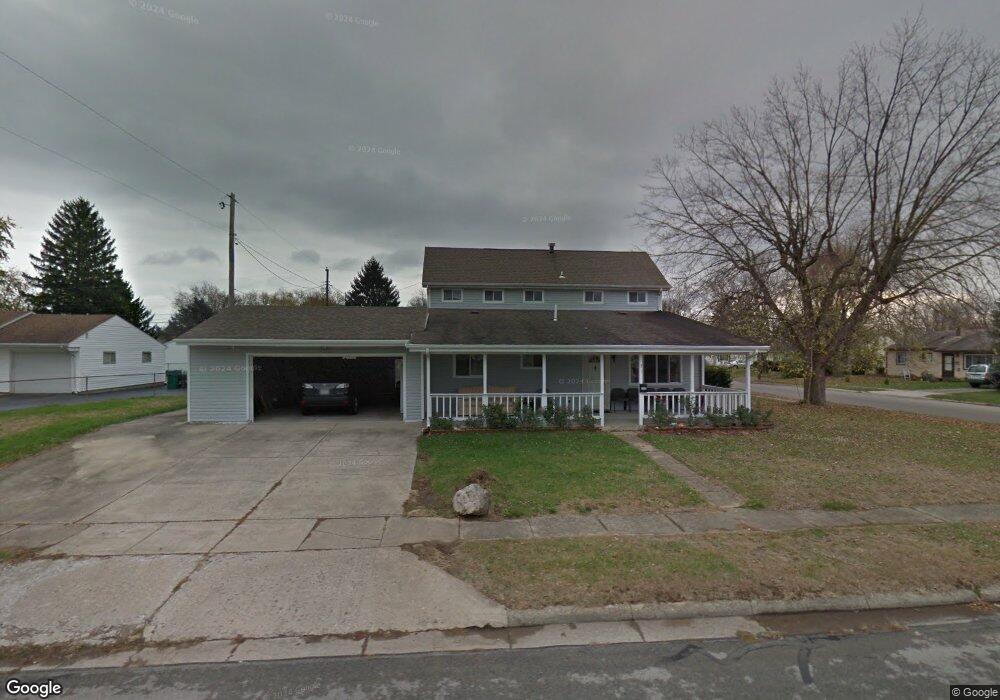
31 Richwood Ct Fairborn, OH 45324
Estimated Value: $191,000 - $214,790
3
Beds
2
Baths
1,873
Sq Ft
$111/Sq Ft
Est. Value
About This Home
This home is located at 31 Richwood Ct, Fairborn, OH 45324 and is currently estimated at $207,198, approximately $110 per square foot. 31 Richwood Ct is a home located in Greene County with nearby schools including Fairborn Primary School, Fairborn Intermediate School, and Fairborn Middle School.
Ownership History
Date
Name
Owned For
Owner Type
Purchase Details
Closed on
Jan 26, 2007
Sold by
Watson Penny A and Watson Garry
Bought by
Lee Kha T and Nguyen Anh Td
Current Estimated Value
Home Financials for this Owner
Home Financials are based on the most recent Mortgage that was taken out on this home.
Original Mortgage
$86,400
Outstanding Balance
$10,204
Interest Rate
6.19%
Mortgage Type
Unknown
Estimated Equity
$196,994
Create a Home Valuation Report for This Property
The Home Valuation Report is an in-depth analysis detailing your home's value as well as a comparison with similar homes in the area
Home Values in the Area
Average Home Value in this Area
Purchase History
| Date | Buyer | Sale Price | Title Company |
|---|---|---|---|
| Lee Kha T | $108,000 | Attorney |
Source: Public Records
Mortgage History
| Date | Status | Borrower | Loan Amount |
|---|---|---|---|
| Open | Lee Kha T | $86,400 |
Source: Public Records
Tax History Compared to Growth
Tax History
| Year | Tax Paid | Tax Assessment Tax Assessment Total Assessment is a certain percentage of the fair market value that is determined by local assessors to be the total taxable value of land and additions on the property. | Land | Improvement |
|---|---|---|---|---|
| 2024 | $2,483 | $51,850 | $9,690 | $42,160 |
| 2023 | $2,483 | $51,850 | $9,690 | $42,160 |
| 2022 | $1,853 | $32,580 | $6,920 | $25,660 |
| 2021 | $1,881 | $32,580 | $6,920 | $25,660 |
| 2020 | $1,890 | $32,580 | $6,920 | $25,660 |
| 2019 | $2,013 | $34,730 | $7,130 | $27,600 |
| 2018 | $2,034 | $34,730 | $7,130 | $27,600 |
| 2017 | $2,041 | $34,730 | $7,130 | $27,600 |
| 2016 | $2,042 | $34,840 | $7,130 | $27,710 |
| 2015 | $1,947 | $34,840 | $7,130 | $27,710 |
| 2014 | $1,883 | $34,840 | $7,130 | $27,710 |
Source: Public Records
Map
Nearby Homes
- 849 Flintridge Dr
- 608 S Maple Ave
- 5 Marchmont Dr
- 97 Marchmont Dr
- 3 Holgate Ct
- 849 S Maple Ave
- 139 Hower Ln
- 852 Princeton Ave
- 869 S Maple Ave
- 849 Princeton Ave
- 320 E Xenia Dr
- 66 S Central Ave
- 860 Washington Ave
- 20 Ramona Dr
- 340 Holmes Dr
- 43 Lindway Dr
- 112 E Xenia Dr
- 000 Morris Dr
- 1108 Lexington Ave
- 1040 S Central Ave