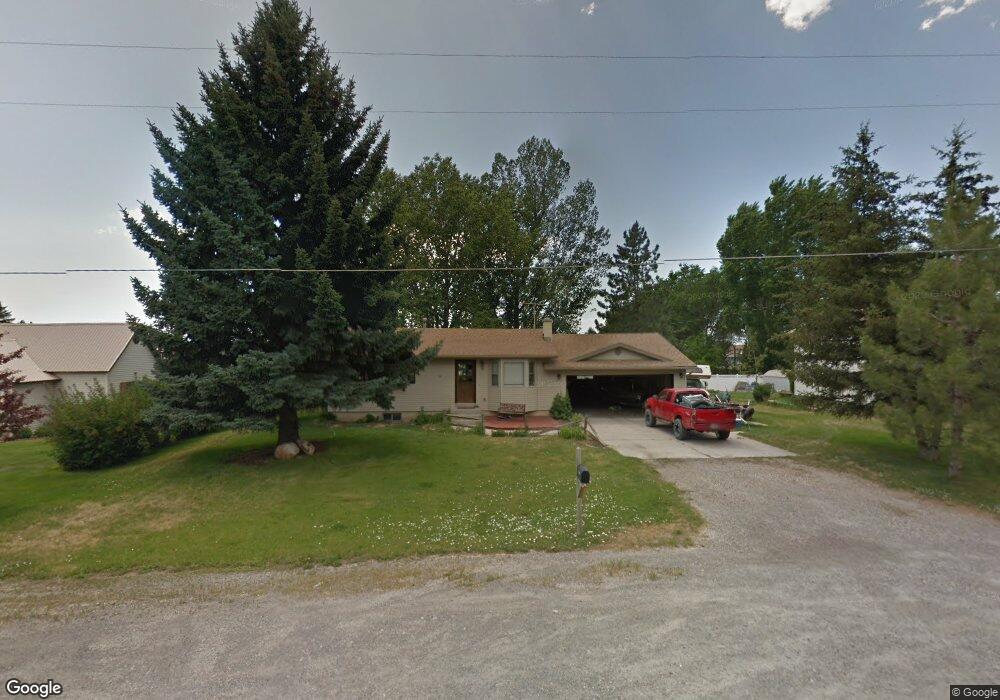
31 S 300 W Smithfield, UT 84335
Estimated Value: $385,000 - $416,000
4
Beds
2
Baths
1,824
Sq Ft
$220/Sq Ft
Est. Value
About This Home
This home is located at 31 S 300 W, Smithfield, UT 84335 and is currently estimated at $400,597, approximately $219 per square foot. 31 S 300 W is a home located in Cache County with nearby schools including Summit School, North Cache Middle School, and White Pine Middle School.
Ownership History
Date
Name
Owned For
Owner Type
Purchase Details
Closed on
Sep 28, 2021
Sold by
Bellon Bridger and Bellon Athena
Bought by
Bellon Bridger and Bellon Athena
Current Estimated Value
Purchase Details
Closed on
Jun 20, 2016
Sold by
Boehme Shaun D and Boehme Nicole
Bought by
Bellon Bridger and Bellon Athena
Home Financials for this Owner
Home Financials are based on the most recent Mortgage that was taken out on this home.
Original Mortgage
$185,089
Outstanding Balance
$147,248
Interest Rate
3.64%
Mortgage Type
New Conventional
Estimated Equity
$253,349
Purchase Details
Closed on
Dec 10, 2007
Sold by
Downs Brett Lee and Downs Judy A M
Bought by
Boehme Shaun D and Boehme Nicole
Home Financials for this Owner
Home Financials are based on the most recent Mortgage that was taken out on this home.
Original Mortgage
$159,743
Interest Rate
6.3%
Mortgage Type
FHA
Create a Home Valuation Report for This Property
The Home Valuation Report is an in-depth analysis detailing your home's value as well as a comparison with similar homes in the area
Home Values in the Area
Average Home Value in this Area
Purchase History
| Date | Buyer | Sale Price | Title Company |
|---|---|---|---|
| Bellon Bridger | -- | None Available | |
| Bellon Bridger | -- | Cache Title Logan | |
| Boehme Shaun D | -- | American Secure Title |
Source: Public Records
Mortgage History
| Date | Status | Borrower | Loan Amount |
|---|---|---|---|
| Open | Bellon Bridger | $185,089 | |
| Previous Owner | Boehme Shaun D | $159,743 |
Source: Public Records
Tax History
| Year | Tax Paid | Tax Assessment Tax Assessment Total Assessment is a certain percentage of the fair market value that is determined by local assessors to be the total taxable value of land and additions on the property. | Land | Improvement |
|---|---|---|---|---|
| 2025 | $1,563 | $209,245 | $0 | $0 |
| 2024 | $1,639 | $205,775 | $0 | $0 |
| 2023 | $1,710 | $203,065 | $0 | $0 |
| 2022 | $1,738 | $203,065 | $0 | $0 |
| 2021 | $1,681 | $300,160 | $70,000 | $230,160 |
| 2020 | $1,572 | $261,800 | $70,000 | $191,800 |
| 2019 | $1,436 | $228,041 | $45,000 | $183,041 |
| 2018 | $1,303 | $200,120 | $45,000 | $155,120 |
| 2017 | $1,203 | $100,925 | $0 | $0 |
| 2016 | $1,225 | $88,000 | $0 | $0 |
| 2015 | $1,072 | $88,000 | $0 | $0 |
| 2014 | $886 | $74,140 | $0 | $0 |
| 2013 | -- | $74,140 | $0 | $0 |
Source: Public Records
Map
Nearby Homes
Your Personal Tour Guide
Ask me questions while you tour the home.