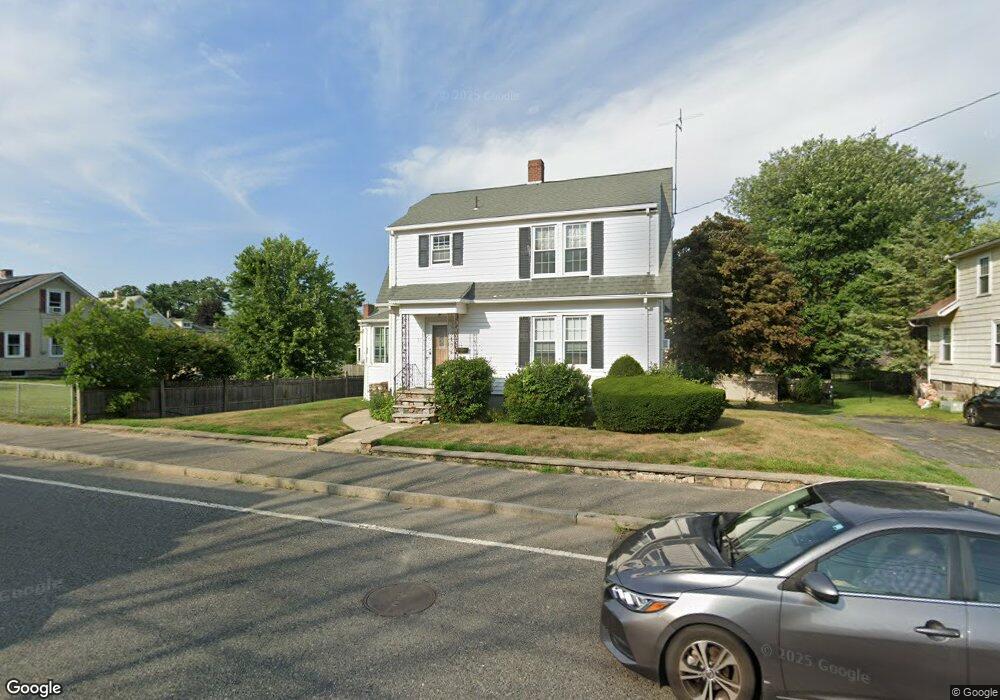
31 S Main St Bellingham, MA 02019
Estimated Value: $438,000 - $577,000
3
Beds
2
Baths
1,344
Sq Ft
$365/Sq Ft
Est. Value
About This Home
This home is located at 31 S Main St, Bellingham, MA 02019 and is currently estimated at $490,750, approximately $365 per square foot. 31 S Main St is a home located in Norfolk County with nearby schools including Joseph F. DiPietro Elementary, Bellingham High School, and Rise Prep Mayoral Academy Middle School.
Ownership History
Date
Name
Owned For
Owner Type
Purchase Details
Closed on
Jun 25, 2010
Sold by
Mcdonough Sandra J
Bought by
Mic Mac Rt and Mcdonough Sandra J
Current Estimated Value
Purchase Details
Closed on
Mar 31, 1999
Sold by
Murphy David H and Murphy Sarah M
Bought by
Ford Erica M
Home Financials for this Owner
Home Financials are based on the most recent Mortgage that was taken out on this home.
Original Mortgage
$163,800
Interest Rate
6.78%
Mortgage Type
Purchase Money Mortgage
Purchase Details
Closed on
Aug 18, 1992
Sold by
Somerville Ext Janette
Bought by
Livingstone William B
Home Financials for this Owner
Home Financials are based on the most recent Mortgage that was taken out on this home.
Original Mortgage
$100,000
Interest Rate
8.26%
Mortgage Type
Purchase Money Mortgage
Purchase Details
Closed on
Apr 1, 1991
Sold by
Abbruzzese Michael J and Abbruzzese Anna A
Bought by
Murphy David H and Murphy Sarah M
Home Financials for this Owner
Home Financials are based on the most recent Mortgage that was taken out on this home.
Original Mortgage
$125,000
Interest Rate
9.17%
Mortgage Type
Purchase Money Mortgage
Purchase Details
Closed on
Nov 13, 1972
Bought by
Mic Mac Rt
Create a Home Valuation Report for This Property
The Home Valuation Report is an in-depth analysis detailing your home's value as well as a comparison with similar homes in the area
Home Values in the Area
Average Home Value in this Area
Purchase History
| Date | Buyer | Sale Price | Title Company |
|---|---|---|---|
| Mic Mac Rt | -- | -- | |
| Ford Erica M | $195,000 | -- | |
| Livingstone William B | $100,000 | -- | |
| Murphy David H | $150,000 | -- | |
| Mic Mac Rt | -- | -- |
Source: Public Records
Mortgage History
| Date | Status | Borrower | Loan Amount |
|---|---|---|---|
| Previous Owner | Mic Mac Rt | $163,800 | |
| Previous Owner | Mic Mac Rt | $100,000 | |
| Previous Owner | Mic Mac Rt | $125,000 |
Source: Public Records
Tax History Compared to Growth
Tax History
| Year | Tax Paid | Tax Assessment Tax Assessment Total Assessment is a certain percentage of the fair market value that is determined by local assessors to be the total taxable value of land and additions on the property. | Land | Improvement |
|---|---|---|---|---|
| 2025 | $4,573 | $364,100 | $130,100 | $234,000 |
| 2024 | $4,384 | $340,900 | $118,700 | $222,200 |
| 2023 | $4,226 | $323,800 | $113,100 | $210,700 |
| 2022 | $4,142 | $294,200 | $94,300 | $199,900 |
| 2021 | $3,994 | $277,200 | $94,300 | $182,900 |
| 2020 | $3,694 | $259,800 | $94,300 | $165,500 |
| 2019 | $3,614 | $254,300 | $94,300 | $160,000 |
| 2018 | $3,385 | $234,900 | $95,100 | $139,800 |
| 2017 | $3,301 | $230,200 | $95,100 | $135,100 |
| 2016 | $3,200 | $223,900 | $99,000 | $124,900 |
| 2015 | $3,067 | $215,200 | $95,100 | $120,100 |
| 2014 | $3,062 | $208,900 | $91,800 | $117,100 |
Source: Public Records
Map
Nearby Homes